1.3. DIY: A Hands-On Experience in the Museum

Museums have traditionally been spaces where visitors passively observe artifacts, but DIY elements are changing the game. By involving visitors in the creation process, museums foster a sense of ownership, creativity, and deeper engagement.

What is DIY (Do-It-Yourself)?

According to the Cambridge dictionary, DIY (Do-It-Yourself) is “the activity of decorating or repairing your home, or making things for your home yourself, rather than paying someone else to do it for you:” [1] This practice has grown from a niche activity into a significant cultural phenomenon, emphasizing accessibility, creativity, and self-empowerment. This is particularly evident in DIY spaces, such as laboratories, which are pivotal for grassroots innovation, fostering personal motivation and community-driven goals. [2]

Why DIY? The Science Behind Engagement

DIY fosters engagement and provides a hands-on approach to learning, encouraging curiosity and active participation. Studies show that tactile and interactive experiences stimulate deeper cognitive and emotional connections, making content more impactful for diverse audiences. This is particularly important in museums, which aim to educate while inspiring creativity and curiosity. [2] [6]

DIY Applications in Museums

In museums, DIY elements translate into interactive exhibits and workshops where visitors actively participate in creating or exploring concepts.

Examples include:

The Tech Interactive’s Biotinkering Lab, where visitors engage in hands-on biotech experiments. It is a creative space to explore biotechnology and biological sciences. Through engaging activities, the lab encourages participants to use biodesign and experiment with sustainable materials, genetics, and new technologies. Its primary focus is to make science accessible, fun, and inspiring for people of all ages. [3]

The Art of Tinkering Workshop is a three-day session at the Exploratorium designed for educators to explore tinkering as a teaching approach. Participants engage in hands-on activities, reflect on their experiences, and learn strategies to encourage creativity, problem-solving, and critical thinking in their classrooms. The workshop focuses on creating supportive environments, enhancing facilitation skills, and integrating tinkering into education. [4]

Challenges of DIY in Museums

Despite their benefits, DIY initiatives face challenges. Funding constraints often limit the scope of these programs, while scalability remains a concern for integrating DIY across broader audiences. Ethical considerations, especially in fields like biotechnology, add another layer of complexity. Museums must balance creativity with safety and accessibility, ensuring that DIY activities remain inclusive and impactful. [5] [6]

Looking Forward: DIY’s Potential

The future of do-it-yourself (DIY) activities in museums is about connecting these projects with wider educational and innovative goals. By building partnerships and engaging with communities, museums can offer more DIY programs that are affordable and can benefit society. It’s important to appreciate the unique value that DIY practices bring, as they can have a positive impact on education, businesses, and more. [2][5]

Sources

  1. Cambridge Dictionary, “DIY,” Cambridge Dictionary. [Online]. Available: https://dictionary.cambridge.org/dictionary/english/diy
  2. M. D. Dzandu and B. Pathak, “DIY Laboratories: Their Practices and Challenges – A Systematic Literature Review,” Technology Analysis & Strategic Management, vol. 33, no. 10, pp. 1242–1254, 2021. DOI: 10.1080/09537325.2021.1968373.
  3. The Tech Interactive. (n.d.). “The Biotinkering Lab.” [Online]. Available: https://www.thetech.org/explore/exhibits/the-biotinkering-lab/biotinkering-community-of-practice.
  4. Exploratorium. (n.d.). “Art Tinkering Workshop.” [Online]. Available: https://www.exploratorium.edu/tinkering/our-work/calendar/art-tinkering-workshop.
  5. W. You, W. Chen, M. Agyapong, and C. Mordi, “The Business Model of Do-It-Yourself (DIY) Laboratories – A Triple-Layered Perspective,” Technological Forecasting & Social Change, vol. 159, pp. 120205, 2020. DOI: 10.1016/j.techfore.2020.120205.
  6. H. Charman, “Designerly Learning: Workshops for Schools at the Design Museum,” Design and Technology Education: An International Journal, vol. 15, no. 3, pp. 28–40, 2010.

The Journey of Documenting – Writing a Proposal

Once you have successfully answered the questions of why you want to create your documentary, what it should be about at its core and how you want to convey the message, the next, often tedious, step is to figure out who you want to finance the endeavour and who you want your target audience to be.

Proposal
Writing a proposal will not only be quintessential for convincing funders of your idea, but it will also help you figure out whether you have spent enough time on the topic and on your plans for the documentary to be able to concisely and clearly explain what the film will be about in one to two pages. It is a good test to see whether someone else will be able to see your vision and understand the film from your description. Moreover, a proposal can help you gain access to people or organisations by making your intentions appear more credible (Glynne, 2007).

Your project description should include aspects like the approximate outline of your story, so where it begins and how it should develop, some background information, whether that be historic or any other context, your visual approach for the film, a short introduction to your characters, your unique selling points, motivations and reason for the film, and what kinds of access you need and ideally have for filming your documentary (IDFA, 2025).

Structuring your proposal in a way that is informative and enticing is crucial to make sure the reader’s interest will be caught. Here are some of the things to keep in mind when structuring your text:

  • The Title:
    It should be catchy and informative in order to attract attention while at the same time making sure viewers know what to expect from your film. During the last years, the trend has gone towards using sensationalised, almost “clickbait-y” titles for documentaries, however especially European documentaries still often go for rather poetic names, like the Finnish film “3 Rooms of Melancholia” (2004) about the Second Chechen War (The 3 Rooms of Melancholia – Wikipedia, 2025).
    Next to the title you might want to put the approximate length of your documentary. If you are looking to get funded by broadcasters it is especially important to ensure that the film you have planned is suited for their schedule, both content-wise and duration-wise, so make sure to do your research before pitching your idea (Glynne, 2007).
  • The Opening Paragraph:
    As you will probably one among many applying for funding, commissioning editors will often only skim through your proposal to determine whether they deem it worthy of further attention. This means that your opening paragraph has to be able to convince its readers within the first couple of sentences to keep reading the rest of the proposal. In this paragraph you should outline who or what the subject of your documentary is going to be and what is specific to your film. Ideally these two make sense together and bring across a cohesive image of your vision for the project. Your proposal should not sound too academic, whilst still staying professional. One good way to see whether your opening paragraph is convincing enough is to read it as though you were a potential viewer, deciding whether you would want to watch the described documentary or not (Glynne, 2007).
  • Character and Narrative:
    Your readers should get an idea of who the characters of your story are and what will happen to them over the course of the film. If your documentary relies on a few main characters, describe them briefly and explain what makes their stories so special and why you believe, that they belong in front of a camera, your camera to be specific. Make sure your readers can already form an emotional connection to the subjects and get them invested in the stories you want to tell (IDFA, 2025).
  • The Style:
    Which style you chose for your documentary (as explained in the previous blogpost) should already be clear from how your first paragraph is written. This can be another good way of checking whether you have been precise enough in your writing, to see whether readers can unmistakably tell which type of documentary they can expect from reading just the opening paragraph of your proposal (Glynne, 2007).
  • The Cost:
    Potential investors want to get an idea of what costs they might expect. While you don’t need to have a fully planned out budget at this stage, this might be the opportunity to justify seemingly high future costs to your potential funders (Glynne, 2007).
  • You:
    Write a few sentences about who you are and what connects you to the topic of the documentary. Ask yourself “Why me?” and convince your readers why you should be the one to tell this story. This is also where you should list any relevant experience or expertise on the topic in order to assure potential future investors of your competence (Glynne, 2007).
  • Company and Executive Producer:
    Working with a production company and having an executive producer on board will give potential sponsors the assurance they might need to invest in your endeavour. Being backed by a production company and having an executive producer who will make sure you deliver high-quality results increases your credibility and makes your more trustworthy to potential funders (Glynne, 2007).

Proposal versus Treatment/Sript

Although many terms in the field are frequently used interchangeably, it can generally be said that while a proposal is around 1 to 2 pages long and is often the first step to catching the attention of a commissioning editor or funding organisation, a treatment or script is a much longer document, outlining the narrative in detail and might include the director’s statement about why they want to make the film (Glynne, 2007).

Conclusion
A proposal is the most important piece of text for getting your idea noticed and funded. The reader should get a clear image of what the documentary will look like and become emotionally invested in seeing you succeed and in witnessing your idea becoming a reality.

Literature

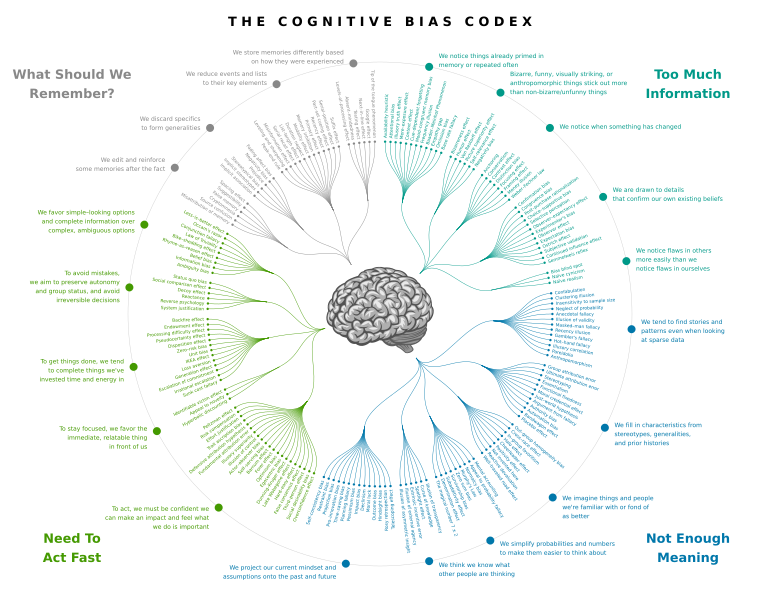
05 The Cognitive Bias Codex – Too much Information

Source: Wikipedia

The Cognitive Bias Codex, by Buster Benson, is a visualization of over 200 cognitive biases, offering an overview of how our minds work. Inspired by his childhood, Benson developed the Codex to help others understand and mitigate the influence of biases. The Codex encourages critical thinking and greater self-awareness, empowering individuals to make more informed and balanced decisions. (cf. Emergent Thinkers) It separates all biases into 4 problem groups: Too much information, not enough meaning, need to act fast & “What should we remember?”. This and the following blogposts will explain one of the four categories, reflecting on the different biases within them and their impact on UX work.

Each category shows a broad problem definition, which is then split up into different behaviors we show or have. Below these there are effects or biases that explain why we have these behaviors, since they are a combination of all our biases and influences from our surroundings. To make this shorter and easier to read, I will not go into detail on every single bias and effect there is. (At least not in this blog post. ;D)

01 Information Processing

This category of the cognitive bias codex highlights how our brains handle the massive amounts of data we encounter daily. These biases influence how we collect, interpret, and remember information, often simplifying them to help us make decisions faster. While these mental shortcuts can be useful, they also shape our beliefs, judgments, and actions in ways we may not fully realize. Exploring this category helps to uncover hidden filters in our thinking, enabling us to better evaluate information, recognize distortions, and make decisions with more clarity. (cf. Gust de Backer)

01.1 Primed or Repeated Information

Our attention is drawn to information that aligns with what we already know. This makes certain details seem more important than others. The list of biases is very long, so here are the five biases I consider most important for UX Design.

  1. Availability Heuristic
    People judge the likelihood of events based on how easily examples come to their mind. This can lead to skewed decision-making, as recent experiences are more easily recalled and seem more common than they actually are. In UX design, using familiar examples or well-known patterns can help users make quicker decisions. (cf. Beyond UX Design C)
  2. Attentional Bias
    People tend to pay more attention to certain types of information while ignoring others, based on personal preferences, emotions, or past experiences. This means users are more likely to notice and engage with elements that are emotionally charged, eye-catching, or familiar. (cf. Beyond UX Design D)
  3. Mere-Exposure Effect
    People tend to develop a preference for things because they are exposed to them repeatedly. This effect can be used by consistently presenting certain features or brand elements, making users more comfortable and familiar with them. Over time, familiarity can lead to greater trust and engagement. (cf. Beyond UX Design F)

  4. Empathy Gap
    People fail to predict how emotions and mental states affect their behavior, leading to misunderstandings. For example, when not hungry, we might rationally predict we would choose a healthy snack, but in a hungry state, we’re more likely to pick something unhealthy. Understanding this gap helps in designing user experiences that anticipate emotional states and provide supportive features or messaging.
    (cf. The Decision Lab B)
  5. Omission Bias
    Harmful actions are perceived as worse than harmful inactions, even if the consequences are similar. For instance, people may feel less guilty about allowing negative outcomes than if they actively caused harm. Users might prefer passive features, like automatic settings, that avoid perceived responsibility or failure. Designers can use this by considering user preferences for default options or avoiding overwhelming users with too many choices. (cf. The Decision Lab C)

01.2 Attention-Grabbing Details

Unusual or emotional things captivate us, our brains are wired to notice things that are out of the ordinary. These biases make us prioritize spectacle over substance, they show us how we can make important information stand out and make our users remember it.

  1. Von Restorff Effect (The Isolation Effect)
    When multiple similar items are presented, the one that stands out is more likely to be remembered. This can be applied in UX design by making important elements or actions visually distinct. However, it’s crucial to avoid overwhelming users by overusing emphasis and to be mindful of accessibility issues, such as color vision deficiencies or motion sensitivity.
    (cf. Laws of UX)
  2. Picture Superiority Effect
    People tend to remember pictures better than words, visuals are processed in two ways as images and as associated words, while words are processed only as text. In UX design, using clear, literal images can improve memorability and comprehension. Effective placement of visuals, using unique images, and avoiding abstract visuals are key strategies to take advantage of this effect.
    (cf. NN Group B)
  3. Self-Relevance Effect
    People are more likely to remember information that they relate to themselves. This bias enhances memory retention when we connect new knowledge to personal experiences. In UX design, leveraging this effect could involve personalizing content, such as customized recommendations or user-centered messages, to improve engagement and retention. For example, presenting content that users can relate to personally, such as reminders tied to their preferences or past behaviors, can make the experience more memorable.
    (cf. The Behavioral Scientist D)

01.3 Novelty and Change

Elements that are new to us or in motion naturally capture our attention. However, this can make us overlook stable, ongoing factors that are equally significant.

  1. Anchoring
    This bias occurs where initial information, such as a suggested value, influences subsequent decisions. While anchoring can guide users to make decisions that align with desired outcomes, it can also unintentionally restrict creativity and objective thinking. (cf. Beyond UX Design B)
  2. Distinction bias
    This means, that we evaluate options differently when we asses them together or separately. This often leads to misjudgments, when viewing options side-by-side minor differences may seem disproportionately important. For example, comparing two similar products might exaggerate their distinctions. (cf. The Decision Lab A)
  3. Framing Effect
    People react differently depending on whether the same information is framed positively or negatively, influencing decisions. For example, a product described as “95% effective” might be more appealing than one described as “5% ineffective,” even though both mean the same. This bias underscores the power of context and language in shaping perceptions and choices.
    (cf. The Decision Lab B)
  4. Weber–Fechner Law
    The Weber–Fechner law is about how we sense changes, like light, sound, or weight. It says we notice small changes when something is light or quiet, but bigger changes are needed if something is already heavy or loud. For example, if you’re holding a tiny feather and add another, you’ll notice the difference. But if you’re carrying a heavy backpack, adding one feather won’t feel like much. Imagine having a website in a very clean look with very little visual clutter, little changes will be noticed easier, than on a website with a lot of flashing colors and pictures. (cf. The Behavioral Scientist C)

01.4 Confirm Believes

Confirmation bias leads us to favor information that supports what we already think or feel, reinforcing existing opinions and blinding us to contrary evidence. There are a lot of effects and biases listed in this category here are the ones that I consider most important for UX Work:

  1. Confirmation & Congruence Bias
    The confirmation bias describes the tendency to favor information that aligns with existing beliefs, leading to overlooking or dismissing contradictory views. The congruence bias is very similar, it describes the inclination to test hypotheses through direct confirmation, neglecting alternative possibilities, which can result in flawed conclusions. Especially during user testing this could hinder the advance of products. Since the goal is to find the flaws and shortcomings of a product, this could lead to them being overlooked. (cf. Beyond UX Design B, Philosophy Terms)
  2. Expectation Bias (Experimenter Bias)
    This describes the tendency for researchers to unintentionally (or intentionally) influence their study outcomes to align with their expectations, potentially skewing results. Since UX designers have to work with a lot of data, this could once again lead to missteps during the design process and the need to redesign the product later. (cf. The Behavioral Scientist A)
  3. Choice-Supportive Bias
    The tendency to remember past choices as better than they were, often by attributing positive features to selected options and negative ones to rejected alternatives. This could, on a small scale influence, how users give feedback to researchers after a testing session. Highlighting what went well and neglecting frustrating experiences, which could make a product seem better than it actually is. Paying attention to what people do is important to later compare this to what they said. (cf. The Behavioral Scientist B)
  4. Observer Effect
    A phenomenon one is very likely to come across while doing user research. Individuals tend to modify their behavior due to being observed, which can impact the authenticity of observed actions. Which is totally understandable, you wouldn’t want to be perceived as stupid or incapable in front of another person. (cf. NN Group A)

01.5 Spotting Flaws

It’s easier to spot mistakes or biases in other people than our own, making us more critical of others and less about our own behavior. The codex depicts three biases in this subcategory:

  1. Bias blind spot & Naive realism
    (I have already written a blog post about this bias ;D)
    We tend to think, that we see the world objectively (as it really is) and others don’t. We are convinced or information is correct and others who don’t share our views are misinformed or biased. Recognizing naïve realism helps us appreciate diverse perspectives and approach disagreements with empathy. Which is a key ability for UX designers in my book.(cf. Jakob Schnurrer)
  2. Naive cynicism
    We mistakenly believe others are more selfish than they actually are, often misinterpreting their intentions. This bias can strain relationships, create mistrust, and hinder collaboration, especially in team settings. Practices like active listening, open communication, and team-building help prevent misunderstandings and promote a more supportive environment.
    (cf. Beyond UX Design A)

Wag the Dog: Propaganda within a film and the role of storytelling

In the world of political manipulation and propaganda, the 1997 film “Wag the Dog” has a special place. The satire, directed by Barry Levinson, shows how a political scandal is covered up by staging a fictitious war. The film offers an entertaining but also frightening perspective on how media and storytelling can be used to influence public opinion. (Levinson, 1997). This blog post analyses the way propaganda techniques are applied within the film. The term “wag the dog” already gives insights into what the movie topic is about. The phrase already indicates that attention is being diverted and the focus lies on something else (Wag The Dog | Phrase Definition, Origin & Examples, n.d.).  

The film begins with a political nightmare: the US president is confronted with a scandal shortly before his re-election. To deflect public attention, his advisor Conrad Brean, played by Robert De Niro, hires a Hollywood producer, Stanley Motss, played by Dustin Hoffman. Together they want to create the illusion of a war against Albania, by creating fake news, patriotic songs, and a tragic heroine story. The plot reveals how easy it is to create an alternative reality with the help of the media. By manipulating emotions and spreading targeted information, the protagonists control the population’s perception – a central propaganda mechanism.

The film clearly shows how emotionalization is used to capture people’s attention. An invented ‘tragic heroine’ is presented whose fate evokes the audience’s sympathy one of the scenes is where a young girl escapes from a destroyed village with a cat. This scene is particularly impressive and influential. This kind of emotional imagery makes the audience forget that the war itself is not real. Hereby showing that the use of emotions is a tried and tested propaganda method that is also used and implemented in the real world. The film adds the targeted repetition and consistency of the message over and over again. The invented story of the war is repeated again and again in various media until it is accepted as truth within the population. This technique makes use of the famous propaganda rule: ‘A lie that is repeated often enough becomes the truth.’

Another central element within the movie is distraction. The staged war is able to distracts the population from the president’s actual scandal and shows how propaganda can be used to control public perception. The film illustrates how crucial it is to control the media in order to spread a certain message. With this visual and narrative elements are staged really well in the film to create credibility and draw the audience’s attention to the chosen narrative and not the present scandal.

“Wag the Dog” is also fascinating from a different point of view. The way images, music, and stories are used shows the importance and impact designs can have on conveying messages. The fake news reports in the film are an impressive illustration of how visual content can be manipulated to create emotions and with this create a certain type of credibility. With this, the musical backing also plays a very crucial role within the movie. A patriotic song called ‘We Are the Land of the Free’ is composed especially for this fictional war just to make the whole story and idea more convincing for the population to believe. Music is used here as a powerful tool to reinforce emotions and anchor a message. 

Although the film was released over 25 years ago, it hasn’t lost its importance and impact. At a time when fake news and disinformation are more common, the message of “Dare the Dog” is more relevant than ever. With this, the film can remind the audience of the importance of critically questioning information and recognizing the power of the media. The mechanisms of manipulation depicted in the movie are even easier to implement today through social media channels and digital platforms and are often more difficult to see through. It shows that those who tell stories have enormous power, which can be used for both a good and bad purpose.

With this the movie “Wag the Dog” is more than just a satire – it is a lesson in how propaganda works and the role that media play in it. The film impressively shows how storytelling can be used to shape reality and influence opinions.  At the same time, the film is an invitation to consumers to question information carefully and not to be influenced by a well-told story. As the movie impressively shows, the line between truth and fiction can be very thin. The film can teach that critical thinking and healthy skepticism are the best tools for recognizing manipulation and arming ourselves against propaganda.

Sources:

Levinson, B. (Director). (1997, December 25). Wag the Dog. Baltimore Pictures, TriBeCa Productions.

Wag the Dog | Phrase Definition, Origin & Examples. (n.d.). https://www.gingersoftware.com/content/phrases/wag-the-dog#

Visual Hierarchy and Information Prioritisation in HUD Design

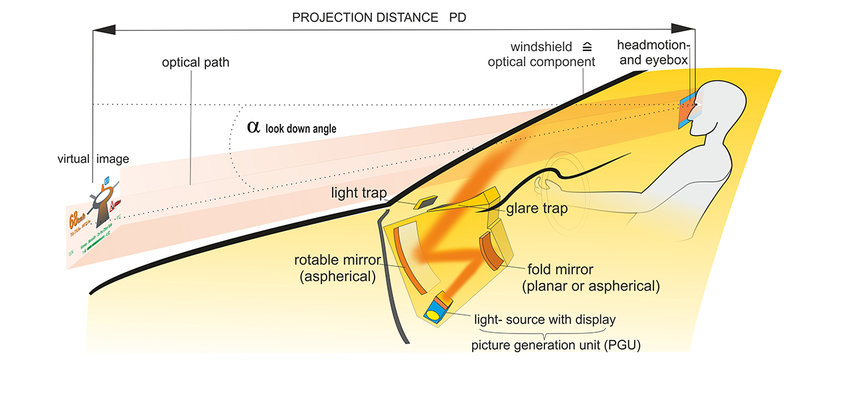
Head-Up Displays (HUDs) have revolutionised the way drivers access key information without taking their eyes off the road. However, with data such as speed, navigation and incoming calls competing for attention, ensuring clarity and usability is critical. The key to achieving this balance is to master the visual hierarchy and effectively prioritise information.

(source: https://www.researchgate.net/figure/How-a-Head-up-display-works_fig5_301776934)

Understanding visual hierarchy

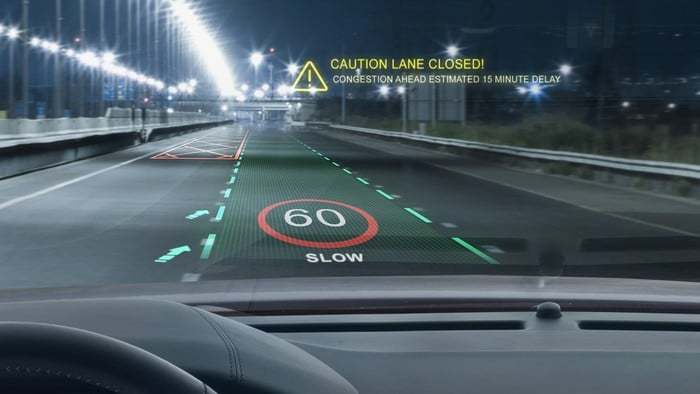
Visual hierarchy refers to the arrangement and presentation of elements in a way that reflects their importance. In HUDs, critical information such as speed, navigation cues and safety alerts need to be immediately recognisable, while secondary details – such as media controls or environmental data – should remain accessible but less prominent.

Key strategies for creating visual hierarchy

  1. Size and placement: Larger and centrally placed elements attract attention first. For example, displaying speed prominently in the centre of the HUD ensures immediate visibility, while positioning navigation arrows slightly offset can direct the driver’s attention as needed.
  2. Contrast and colour: The use of bright or contrasting colours can highlight important information. For example, a red warning symbol will stand out against a neutral background and attract immediate attention.
  3. Grouping and spacing: Organising related data into clusters reduces cognitive load. Grouping metrics such as speed, fuel level and engine alerts together creates logical associations, making it easier for drivers to process information quickly.
  4. Typography: Choosing legible fonts and appropriate sizes ensures quick readability. Key metrics such as speed should be in bold, large type, while less critical details can use smaller, more subtle typography.

(source: https://magic-holo.com/en/all-about-head-up-display-hud/)

Balancing critical and supplemental data

A key challenge in HUD design is to present critical data without cluttering the display. Designers should limit the amount of information displayed at any one time and use progressive display to show additional data only when necessary. For example, navigation directions might only appear when a turn is approaching, reducing unnecessary distractions.

(source: https://www.nuvisionautoglass.com/guide/what-is-a-heads-up-display-in-a-car-windshield/)

Avoiding cognitive overload

To avoid overwhelming the driver, simplicity is key. Studies show that humans can only process a limited amount of information at one time. By focusing on key metrics and minimising distractions, HUDs can improve safety and usability.

Real world examples

Car manufacturers such as BMW have implemented an effective visual hierarchy in their HUDs. BMW’s augmented reality HUD integrates navigation cues directly onto the windscreen, allowing the driver to follow directions without shifting focus.

(source: https://www.becker-tiemann.de/faq/bmw-head-up-display/)

Blog Post 5: Creating a Unified Customer Experience: Integrating AR and IoT Solutions

While each technology offers its own benefits—AR for immersive, context-rich experiences, and IoT for real-time data capture and automation—their combined potential can yield a truly seamless retail journey. Imagine walking into a store where a digital overlay identifies in-stock products based on your past purchases, or scanning a piece of furniture with your phone to see its real-time availability across multiple locations. By unifying AR and IoT, retailers can craft an integrated, data-driven, and visually engaging customer experience.

1. Why Integrate AR and IoT?

Synergistic Benefits

Real-Time Inventory Data Meets Dynamic AR Overlays

AR applications excel at providing context-specific information overlaid on the physical environment. Meanwhile, IoT sensors and systems continuously update inventory data, monitor product conditions, and track usage patterns. By combining these elements, retailers can surface up-to-the-minute stock levels and product availability in a shopper’s AR view.

Personalized Shopping Journeys

IoT sensors (like beacons or RFID tags) can detect when a specific customer’s app or loyalty ID enters a store. This triggers an AR experience tailored to that person’s preferences, past purchases, or membership tier. Shoppers get relevant promotions or guided assistance, creating a delightful, one-of-a-kind experience that goes well beyond standard store interactions.

Potential Scenarios

Smart Mirrors with AR: The mirror’s built-in sensors can automatically detect what items the customer has picked up (via RFID), then display alternative color options, sizes, or accessory suggestions as augmented overlays.

Interactive Showroom: AR glasses or a smartphone’s camera detects IoT-enabled product tags, instantly superimposing product details, reviews, and price comparisons right on the item or shelf in the user’s field of view.

Location-Based Promotions: As a shopper passes by a specific section of the store, IoT beacons trigger AR pop-ups with relevant deals, saving the customer from rummaging through a website or paper coupons.

2. Design Principles for AR/IoT Interactions

2.1 Consistency in Visual Design & Interaction Flow

When bridging two technologies, unified design is paramount:

Color and Branding: Use a consistent palette and brand elements across both the physical and digital layers. If sensors trigger AR pop-ups, those overlays should visually match the store’s aesthetic and signage.

Interaction Cues: Whether a user taps a smartphone screen or uses hand gestures to interact, the metaphors and visual signals should remain consistent. For instance, an AR overlay that highlights “Add to Cart” must have the same shape, iconography, and motion feedback across various store sections.

2.2 Minimizing Friction

Touchless or Seamless Interactions

While some AR apps require taps or swipes, the growing prevalence of gesture-based interactions or voice commands can streamline the user experience—particularly if shoppers have their hands full.

Clear Onboarding

If a customer steps into an IoT-driven store for the first time, they may need quick instructions on how to engage with the AR interface. Simple, step-by-step prompts (e.g., “Point your camera here to see more details”) help users adopt the technology smoothly.

2.3 Balancing Information Density

Avoid Overload

AR overlays can become cluttered if sensors are feeding too much data simultaneously. Designers must judiciously prioritize what’s most relevant for the shopper’s decision-making process, layering additional info behind intuitive prompts or icons.

Context Awareness

The system should intelligently show or hide details based on a shopper’s location and current shopping goal. If the shopper is in the electronics section, highlight device specs and stock levels rather than unrelated promotions.

3. Technical Considerations

3.1 Data Flow Between IoT Sensors and AR Applications

Real-Time Data Pipelines

IoT sensors collect stock data, location info, or environmental conditions (like temperature for perishable goods). These metrics often flow through gateways (e.g., edge devices) to a central cloud platform. The AR application must then pull or subscribe to relevant data streams, ensuring updates occur promptly.

APIs and Protocols

Standard RESTful APIs or WebSocket connections can facilitate two-way communication. For instance, a shopper’s AR query (e.g., “Show me product specs”) prompts the IoT backend to return up-to-date stock info and product details.

3.2 Ensuring Real-Time Synchronization

Latency Minimization

AR experiences falter when data lags. Low-latency networks (5G, Wi-Fi 6) help ensure that when a product is scanned, the system displays correct inventory levels instantly.

Edge Computing

For time-sensitive processes, local edge computing can handle tasks like object detection or sensor data aggregation in near real time, reducing the round-trip to a distant server.

3.3 Security and Privacy

Data Encryption

Communication between IoT devices, AR applications, and the cloud must be secured via encryption (TLS/SSL) to prevent interception of sensitive data (e.g., shopper identity, purchase history).

User Consent & Transparency

Always clarify what data is being collected and how it’s used. If AR overlays rely on location or historical purchase data, prompt shoppers to opt in for personalization.

Early Prototypes & User Flow

While I’m still refining my own AR/IoT integrations, here’s an overview of my initial wireframes and planned user testing strategy:

4.1 Proposed Wireframes / Storyboards

  1. Onboarding Screen

• A short tutorial guiding users to “Scan a product to see real-time availability and color options.”

• Visible instructions explaining AR gestures or minimal taps required.

  1. Main AR View

• When a user points their camera at a shelf, dynamic overlays appear. Each product has a small floating card with name, stock count, and an “Add to Cart” button.

• A color-coded system highlights products nearing low stock (e.g., tinted red) or special offers (e.g., tinted yellow).

  1. Detailed Product Overlay

• Tapping (or hovering over) a product card expands an overlay with extended specs, related items in stock, and a “See in My Room” AR preview if relevant (furniture, decor items).

• Integrates user’s loyalty info: “You have 50 reward points—apply now for 10% off?”

  1. Checkout / Collection Point

• If the user chooses “Add to Cart,” the system pings IoT-powered inventory to reserve the item.

• A final overlay directs them to a designated pick-up counter or prompts for home delivery.

4.2 Preliminary User Testing Plans

Focus Group & Usability Tests

• Recruit participants with varying tech familiarity. Have them complete tasks such as scanning items, checking availability, and adding items to a virtual cart.

• Monitor how quickly they grasp AR controls and whether they find the data overlays intuitive.

In-Store Simulation

• Create a small, mock retail environment with real shelves and products tagged with IoT sensors.

• Observe how quickly users locate items, and whether the AR overlays assist or distract them.

• Solicit feedback on clarity, latency issues, and overall satisfaction.

Key Metrics

Task Completion Time: How long does it take a user to find and add an item to their cart?

Error Rates: Do users accidentally scan the wrong product or struggle to see essential data?

Overall Engagement: Are they delighted by the experience or do they revert to more familiar methods (like checking a shelf manually)?

Merging AR with IoT unlocks new possibilities in retail—from real-time availability overlays to deeply personalized promotions. However, designing a holistic, frictionless experience requires careful attention to UI consistency, latency reduction, and robust security. My early prototypes show promise: users can quickly scan shelves to see up-to-date product information, reserve items, and even enjoy loyalty perks in a single integrated interface.

Blog Post 4: Exploring IoT in Retail

IoT for Retail Applications

2.1 Real-Time Inventory Management

One of the most impactful uses of IoT in retail is real-time inventory tracking. Traditionally, stores rely on manual checks or clunky barcode systems that are time-consuming and prone to error. With IoT:

RFID Tags: Clothing retailer Zara has widely adopted RFID tags to automate inventory counts, reducing out-of-stock situations and improving shelf availability. Store employees can wave an RFID reader over a rack and instantly know which sizes and colors need replenishing.

Beacons: Placed strategically in aisles, these small devices automatically detect and log inventory data. They also help store staff locate products or direct customers to specific items. In some supermarkets, beacons linked to a mobile app can alert staff to low inventory in high-demand sections (e.g., bottled water during a heatwave).

Case Study: Walmart

Walmart has been testing “smart shelves” in multiple locations. These shelves use weight sensors and RFID tags to monitor product levels. When an item runs low, the system automatically alerts staff (or even dispatches autonomous robots) to restock. The result is fewer stockouts and a smoother shopping experience.

2.2 Personalized Marketing & Customer Engagement

IoT enables hyper-personalized shopper experiences. By integrating beacons, apps, and loyalty programs, retailers can tailor offers to each customer’s location and preferences.

Beacon-Triggered Notifications: Large department stores like Macy’s in the U.S. have experimented with beacon technology to send special deals or product suggestions to a shopper’s phone as they pass specific sections, like cosmetics or footwear.

Loyalty Programs: Grocery chains in Asia, such as Aeon in Japan, have started integrating location-based offers with loyalty apps. When a customer walks into a store, the app can highlight discounts on items they frequently purchase. This not only increases sales but also makes the customer feel valued and understood.

Case Study: Starbucks

While not strictly an in-store beacon case, Starbucks has embraced IoT in a broader sense. Its mobile app tracks buying patterns and uses location data to offer personalized drink recommendations, birthday perks, and seasonal promotions in real time. This data-driven approach is integral to Starbucks’ loyalty strategy, encouraging customers to keep coming back for more.

Technical Stack

3.1 Hardware

  1. Sensors & RFID Readers

These form the backbone of inventory management. Sensors gauge environmental variables (like temperature for fresh produce), while RFID readers help quickly scan multiple items at once—unlike barcodes, which require line-of-sight scanning.

  1. Beacons

These low-energy Bluetooth transmitters can detect when a smartphone (with a compatible app) is near. Retailers use beacons to send location-based messages or gather foot-traffic data to improve store layouts.

  1. Gateways & Routers

A gateway device collects data from local sensors (via Bluetooth or Wi-Fi) and sends it to the cloud. Strong, consistent network coverage is essential for seamless data transfer—especially in large spaces like shopping malls or warehouses.

3.2 Software

  1. Cloud Services

Platforms like AWS IoT, Microsoft Azure IoT, or Google Cloud IoT provide secure data storage, real-time analytics, and integration with AI/ML tools. Retailers can mine this data for patterns—like the best times to run flash sales.

  1. Data Analytics Platforms

Tools such as Tableau or Microsoft Power BI create dashboards that visualize complex data sets. Managers can view store performance metrics—like foot traffic, average dwell time in aisles, or inventory turnover—in a user-friendly format.

  1. Mobile Applications

These can be customer-facing (e.g., a rewards app that receives beacon alerts) or staff-facing (e.g., an in-store inventory management app). App design heavily influences how effectively IoT data translates into real-world actions.

Global Case Studies

ISA: Connected Refrigeration Units

Background

• ISA, an Italian manufacturer of commercial refrigeration and display cabinets, needed to connect its units worldwide for predictive maintenance and energy efficiency insights.

• Telenor Connexion provided a managed connectivity solution to ensure each refrigeration unit stayed online and shared data from any global location.

Challenges

• Energy consumption of commercial refrigeration is a significant cost. Early detection of malfunctioning parts is critical to prevent spoilage.

• Manual data logging of temperatures is time-consuming and prone to human error.

• ISA’s clients demand minimal downtime and a solid Service Level Agreement (SLA).

IoT Solution & Results

Sensors & Cloud Connectivity: Digital and analog sensors in ISA’s cabinets monitor temperature, humidity, and performance metrics, uploading data via mobile networks.

Predictive Maintenance: When temperatures rise beyond a certain threshold, service teams get an immediate alert. This reduces food spoilage risks and minimizes maintenance costs by targeting problems in real time.

Global Rollout: Telenor’s global partner network allowed ISA to export connected units worldwide without region-specific connectivity hassles.

Regulatory Compliance: Cloud-based data logs demonstrate consistent temperature ranges, aiding in certification and legal compliance.

Key Takeaway

For retailers selling perishable goods—like gelato or produce—a robust IoT framework similar to ISA’s can lead to significant cost savings and a more reliable customer experience.

Carpigiani: IoT-Enabled Gelato Machines

Background

• Carpigiani, also based in Italy, manufactures over 10,000 ice cream machines annually for international clients—from local shops to major fast-food chains.

• Carpigiani partnered with Telenor Connexion in 2010 to implement a global managed connectivity solution.

Challenges

• Managing different connectivity suppliers in each country became unwieldy as Carpigiani expanded globally.

• They required a single global SIM solution that could function across 400+ mobile networks worldwide.

IoT Solution & Results

Unified Global SIM: Carpigiani can deploy the same connectivity solution no matter where a machine is sold or installed.

Data Analytics: Sensors within each machine send data (e.g., usage rates, component stress, temperature) to the cloud for analysis.

Optimized Maintenance: Carpigiani reduced service costs by scheduling maintenance based on actual usage rather than fixed time intervals—repairing parts right before they might fail.

Remote Monitoring (Teorema System): A specialized platform allows engineers to track machine performance remotely, performing software updates and diagnosing issues without costly on-site visits.

Key Takeaway

Retailers selling or operating machinery (ice cream machines, coffee machines, etc.) can adopt a similar approach to extend product lifecycles, lower operational costs, and offer better service warranties.

Ningbo Sanxing Smart Electric: Next-Gen Smart Meters

Background

• Sanxing, headquartered in China, provides intelligent power distribution solutions, including smart meters and transformers.

• In Q4 2020, a major Scandinavian energy supplier chose Sanxing to supply new smart meters—supported by Telenor Connexion—to align with Sweden’s next-generation smart grid requirements.

Challenges

• Sweden’s population is spread out, meaning the new metering infrastructure must handle both urban and remote areas seamlessly.

• Existing meters needed to be upgraded for higher data accuracy, more detailed reporting, and two-way communication capabilities.

IoT Solution & Results

Flexible, Scalable Connectivity: Telenor’s solution ensures reliable connectivity—even in remote areas—so meters can exchange data in real time.

Detailed Energy Insights: Consumers receive granular data on their electricity use, enabling better energy management and cost savings.

Future-Proof Architecture: The system can integrate more data points (like water or gas usage) down the line, supporting the utility company’s digital roadmap.

Key Takeaway

Although this case lies outside traditional retail, it demonstrates how scaling IoT infrastructure in large and geographically varied markets requires flexible connectivity and robust data analytics. Retailers with multiple warehouse or store locations (including rural areas) should note the importance of reliable connectivity for consistent IoT performance.

OTOY: VR-Based Data Visualization

Background

• OTOY, a California-based company, specializes in 3D rendering and virtual reality technologies.

• Rather than using traditional spreadsheets or static dashboards, OTOY creates immersive simulations that let stakeholders visualize and interact with data in real time.

Application to IoT

Enhanced Simulations: By pulling detailed, real-time data from IoT sensors (for instance, atmospheric conditions, mechanical stress points), OTOY can create ultra-realistic VR models of buildings, products, or environments.

Real-World Performance Testing: Architects, designers, and product managers can virtually “test” how an object or building will fare under certain wind speeds, temperatures, or usage patterns.

Potential for Retail

Store Layout Simulations: Imagine a VR environment that replicates foot traffic patterns from real IoT data, allowing store planners to fine-tune product placement before any physical changes.

Product Demos: Furniture or appliance retailers could let customers walk through a realistic VR environment, see how a product fits in a virtual home, and gather performance data from integrated sensors.

Key Takeaway

OTOY’s work indicates that IoT data visualization can go beyond simple graphs to create immersive, interactive experiences—a potential game-changer for retail store design, product previews, and customer engagement.

Practical Lessons for Retailers

  1. Predictive Maintenance Translates to Predictive Retail

• Just as Carpigiani schedules machine maintenance right before parts fail, retailers can anticipate product reorders, identify declining equipment performance (e.g., POS terminals, store HVAC systems), and avoid downtime.

  1. Global Connectivity Is Key

• Whether it’s machines in multiple countries or chain stores across diverse regions, a single connectivity solution can unify data gathering and analysis. Partnerships with global IoT providers streamline deployments.

  1. Leveraging Big Data for Compliance & ROI

• ISA leveraged real-time data logs to meet food safety standards, while Sanxing provided detailed usage reports for energy regulation. In retail, similar data can aid in sustainability compliance, waste reduction, and targeted marketing.

  1. Immersive Visualization as a Next Step

• Tools like OTOY hint at the future: combining IoT data with VR/AR to model store layouts or product usage scenarios in a highly interactive way. Retailers adopting AR-based product previews (furniture, cosmetics try-ons, etc.) are already moving in this direction.

  1. Scalability & Security

• As you scale, ensure robust data security measures (encryption, secure cloud architecture) to protect customer data and prevent breaches. IoT trust is essential for long-term adoption.

Blog Post 3: User Research

User Research

Exploring User Experience in Retail vs. Online Shopping**

This research was conducted under User Experience class at FH JOANNEUM with Dorota, Veronica, Leila, and me as part of the project. The research explores why users continue to shop in physical retail stores despite the convenience of online shopping. By understanding the user experience in both contexts, we hope to uncover insights that explain the different preferences and behaviors driving users to either shop online or visit retail stores. Results has help to see issues in both of the system and how improvements could be added.

Results of user research

Detailed Findings by Shopping Category

Groceries

In-Store: Young adults (18-30) enjoy in-store grocery shopping for freshness and social interaction, while older adults (45+) rely on trusted local stores to ensure quality.

Online: Urban professionals (25-40) occasionally use online grocery delivery for convenience. However, concerns about freshness and expiration deter many users, especially older ones.

Fashion and Apparel

Try-Before-Buy: Younger users (18-30) buy online from familiar brands to minimize sizing issues. Mid-age adults (30-50) prefer in-store shopping for special occasions, valuing easy return options.

Hybrid Approach: In cities like Moscow, many users browse in-store but purchase online for better deals, though return processes can be a hassle.

Electronics and Gadgets

Research Focus: Young professionals (25-35) rely on online reviews and comparisons before buying, while older users (60+) prefer in-store guidance from staff or family members.

Hybrid Purchases: Urban professionals favor online orders with in-store pickup to inspect products before finalizing.

Furniture and Home Decor

In-Store Preference: Older adults (50+) prefer in-person shopping to assess large items, while younger users (18-30) are comfortable buying smaller decor online if reviews are positive.

Online Challenges: Issues like color and size discrepancies lead some users to opt for in-store pickup.

Health and Beauty Products

Physical Try-On: Younger users buy familiar products online but prefer in-store for new items requiring texture or scent testing. Older adults (50+) trust in-store recommendations for health-related purchases.

Hobbies and Entertainment

Young Adults (18-30): Tend to discover and buy books, games, and sports equipment online due to broader selection and better deals. Social media and online reviews heavily influence their choices.

Older Users (60+): Prefer in-store shopping for hobbies, valuing personal recommendations and the ability to inspect items before buying, especially for gardening or reading.

Pain Points and Frustrations

Delivery and Return Processes

Urban Users (25-45): While Moscow and other large cities provide convenient delivery services, users voiced frustrations about the quality and reliability of some delivery services. Some participants noted that delivery providers failed to follow specific instructions, leading to missed deliveries or delays.

Return Complications: Across age groups, online returns were seen as cumbersome. Users preferred platforms with straightforward return policies or those offering in-store returns for items purchased online. Older users were especially deterred by the requirement to repackage items or arrange for pickup.

Social Influence and Trends

Younger Users (18-30): Heavily influenced by social media and online reviews, younger users were more likely to purchase products trending on platforms like Instagram or TikTok. This age group frequently turns to social media influencers and online reviews when exploring new brands or products.

Older Adults (45+): Social influence was less pronounced among older users, who relied more on personal experience, recommendations from family or friends, and in-store staff advice when making purchases.

Blog Post 2: Literature Research

Literature

1. Introduction

We are witnessing a technological revolution that is reshaping every aspect of commerce. Among the most transformative developments is the Internet of Things (IoT), a network of interconnected devices and sensors capable of gathering and sharing data in real time. According to Blair (2023), the retail sector has emerged as a fertile ground for IoT’s applications, leveraging these technologies to enhance customer engagement, optimize inventory management, and streamline operations. This post provides an overview of current literature and real-world examples—especially Amazon Go—to illustrate the impact, challenges, and solutions associated with IoT in retail.

Case Study: Amazon Go, Revolutionizing Retail with IoT

4.1 Background on Amazon Go

A notable example where IoT significantly shapes retail is Amazon Go—the checkout-free store concept first introduced to employees in December 2016 and later to the public in January 2018. While Amazon Go may not yet have achieved widespread market dominance, it remains a groundbreaking “Just Walk Out” approach that has inspired industry-wide discussions on the future of brick-and-mortar retail (Wingfield 2018).

4.2 Technology Stack

Amazon Go’s technology centers around a well-connected IoT ecosystem. Computer vision, sensor fusion, edge computing, and RFID tags work together to identify a shopper, track items taken from the shelves, and automatically update a virtual cart. This configuration effectively removes the need for traditional checkout processes, charging customers’ Amazon accounts once they exit the store (Maul 2022). From deep learning models to weight sensors on shelves, every aspect of the customer journey is monitored to create a frictionless in-store experience.

4.3 Benefits and Risks

Benefits:

Faster Checkout: Eliminates waiting times, enhances customer satisfaction.

Operational Efficiency: Reduces labor costs by automating checkouts, and collects robust data on consumer shopping behaviors.

Personalization: Data-driven insights help refine inventory decisions and shape marketing campaigns.

Risks:

High Initial Costs: Setting up advanced IoT infrastructure demands significant investment.

Privacy Concerns: Biometric recognition and extensive data collection raise questions about consent and data protection.

Technical Failures: Even minor system glitches can disrupt the customer experience and lead to negative publicity (Walton n.d.).

Challenges and Proposed Solutions

  1. Privacy and Security

Challenge: Biometric and behavioral data collection introduces serious privacy issues.

Solution: Amazon addresses these via data encryption and anonymization practices. Additionally, retailers must adopt transparent data policies and comply with frameworks like GDPR or CCPA.

  1. High Upfront Costs

Challenge: IoT-based systems require substantial financial resources (hardware, software, R&D).

Solution: View IoT as a long-term investment. Over time, efficiency gains (reduced labor costs, improved inventory control) may offset the initial expenditures.

  1. Technological Complexity

Challenge: Implementing IoT requires advanced technical expertise, robust network infrastructures, and continual maintenance.

Solution: Conduct pilot tests to refine hardware and software configurations. Partner with specialized firms offering IoT integration services, and ensure staff are well-trained.

Conclusion

Even though Amazon Go itself has faced some market hurdles—such as store closures—the broader literature emphasizes that IoT remains central to revolutionizing retail. Retailers who adopt IoT can achieve high operational efficiency, gain actionable insights on consumer behavior, and provide personalized experiences that increase customer loyalty. As the technology continues to evolve, so will the opportunities to seamlessly integrate digital and physical retail spaces.

Notably, Amazon’s approach to keeping financial details of Amazon Go confidential signals its focus on research and development. This underscores the notion that the company views IoT-based retail solutions as a long-term, data-driven investment capable of shaping the future of commerce. By monitoring—and in some cases, pioneering—these advancements, Amazon reinforces the belief that IoT is here to stay, driving innovation, efficiency, and customer-centric shopping experiences for years to come.

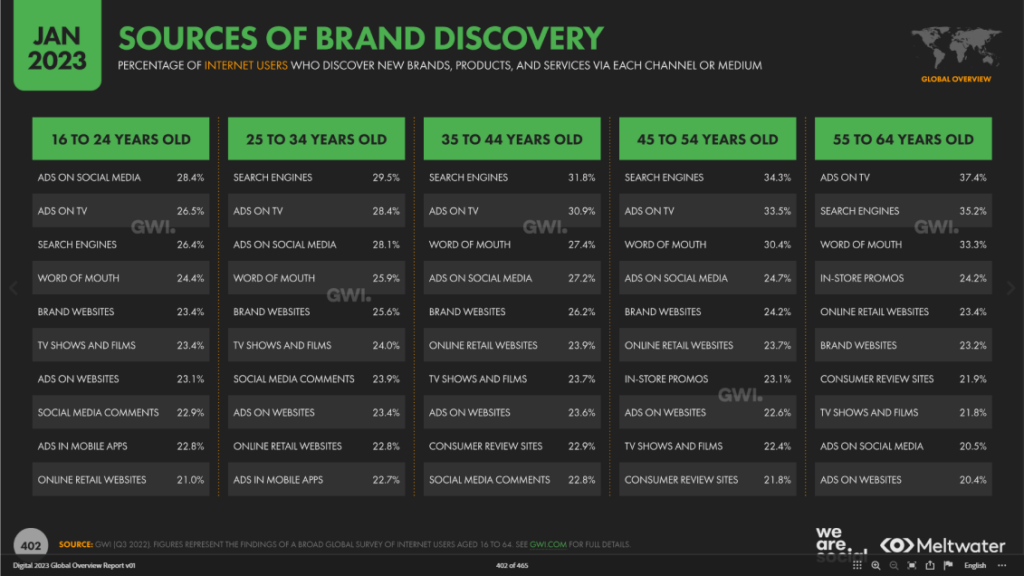
Data about commerce and internet usage

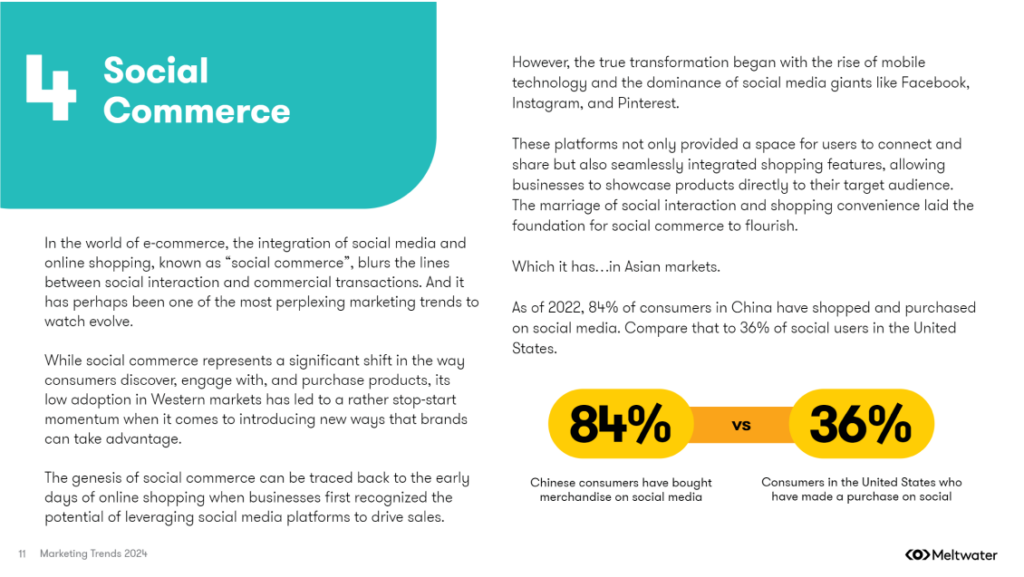
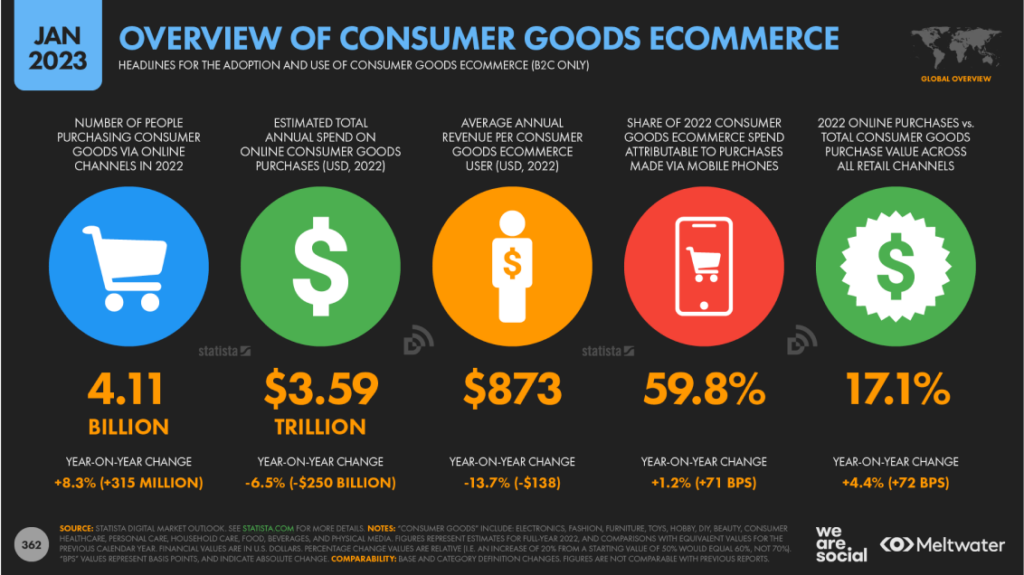
Rising Mobile & Social Influences: As consumers spend more on mobile and discover brands via social networks, it’s critical to design shopping experiences that are seamless, engaging, and highly shareable.

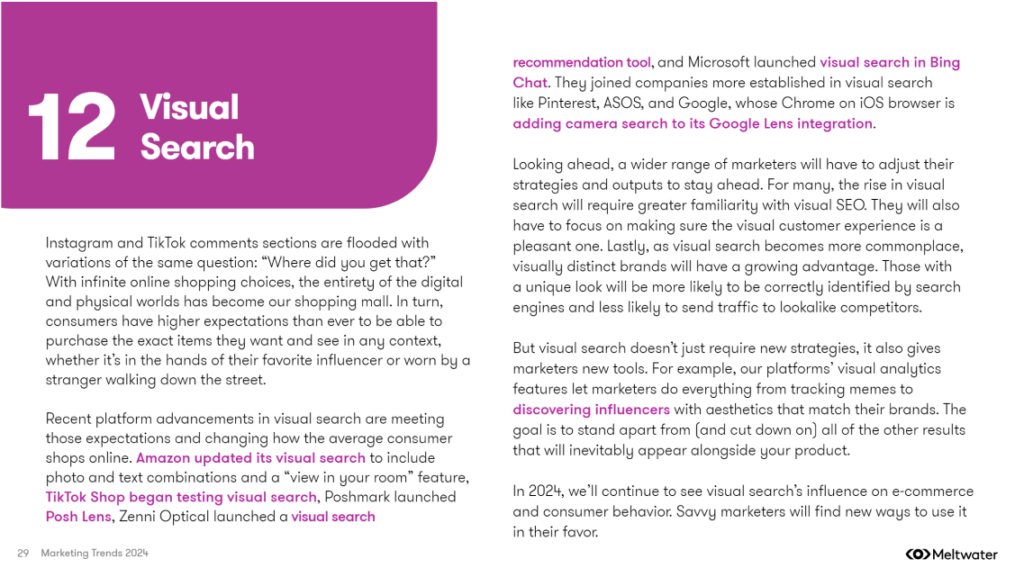
Visual & AR Integrations: Visual search and augmented reality can reduce friction in product discovery and drive higher engagement. Researching how to integrate these tools effectively could yield valuable user insights.

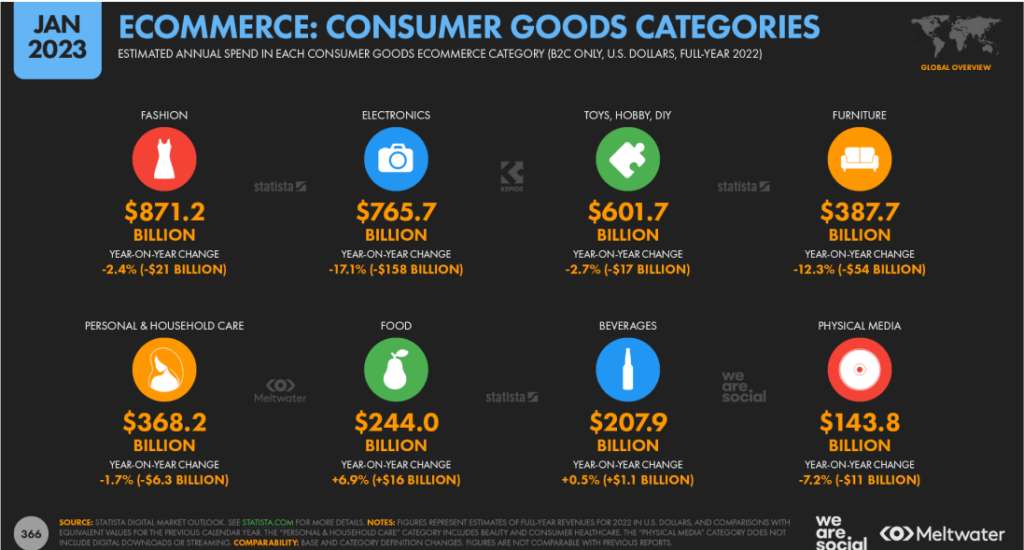
Shifting Category Priorities: Essential categories (like food) are growing, while discretionary items (like electronics) show volatility. Studying consumer sentiment and economic factors can inform better product and UX strategies.

Age-Based Differentiations: Different generations rely on different channels. Tailoring designs and content to these preferences can improve conversion rates.

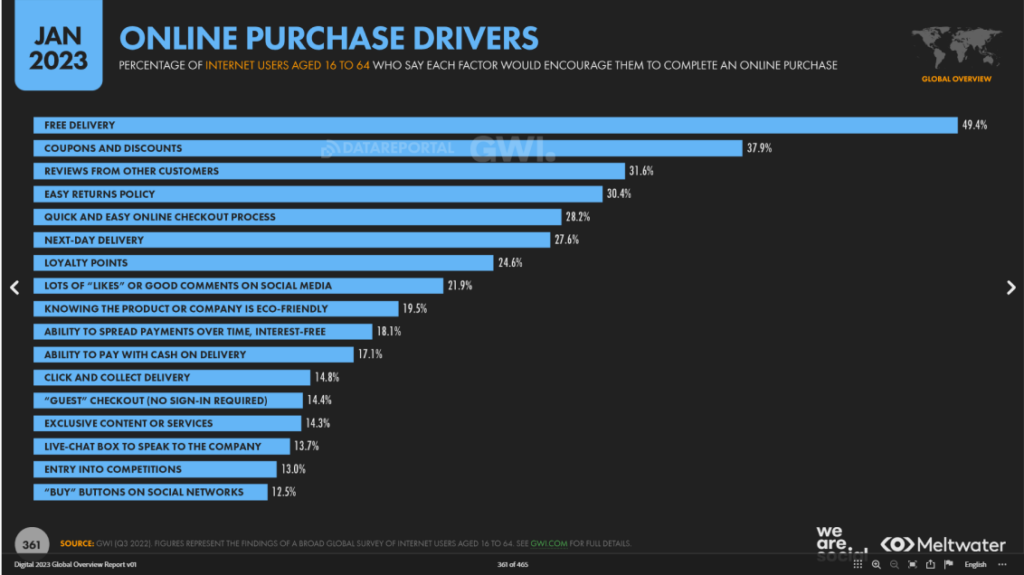
Social Proof & Convenience: Free shipping, reviews, easy returns, and transparent eco-friendly practices remain top motivators. Integrating these features into the user journey can significantly impact purchase decisions.

e-commerce continues to evolve toward mobile- and social-centric experiences, with visual and interactive elements becoming key differentiators. By focusing on seamless user experiences, trust-building features, and strategic channel optimization, brands can align better with evolving consumer behaviors.

Level Up Your Gains: The Benefits of Mascot Based Gameplay

Games featuring mascot gameplay—where players nurture and care for virtual pets or similar characters—offer a distinct experience that sets them apart from games without such mechanics. These games tap into players’ emotional cores, creating bonds that extend beyond simple gameplay. This connection fosters unique engagement, often blending entertainment with emotional and psychological benefits. By exploring the dynamics of these games, we can better understand why they resonate so deeply with players.

Emotional Attachment and Responsibility
Caring for a virtual pet encourages players to build an emotional attachment through repetitive, nurturing interactions. These games simulate the experience of having a dependent creature, which naturally elicits feelings of responsibility. For instance, players may feed, groom, or play with their virtual companions, and neglecting these tasks can result in consequences like an unhappy or sick pet. This interplay of care and accountability fosters a sense of purpose and consistency in player behavior. Unlike traditional games, where engagement is tied to objectives like defeating enemies or solving puzzles, mascot gameplay intertwines success with the pet’s well-being. Research suggests this attachment can positively impact empathy and nurturing behaviors in real life, potentially making players more attuned to caring for others.

Source: SFU – The effects of interacting with a computer-simulated virtual pet dog on children’s empathy and humane attitudes

Enhanced Engagement through Personalization
Mascot gameplay frequently allows players to deeply personalize their virtual pets, which strengthens the emotional bond between the player and the game. Players often have the opportunity to name their pets, customize their appearances, and influence their behaviors or attributes through choices made in the game. This level of personalization fosters a sense of ownership and pride, transforming what could otherwise be a generic in-game character into something truly unique. This customization keeps players invested, as they are not simply progressing in the game but are actively building a relationship with a personalized entity. As a result, the more effort players put into shaping their pets, the more likely they are to stay engaged over time. By comparison, games without this level of customization may struggle to build similar levels of attachment or long-term engagement.

Stress Reduction and Mental Well-being
Interacting with virtual pets is not just entertaining—it can also have therapeutic benefits. Many players report feelings of relaxation and reduced stress while caring for their virtual companions, as the low-stakes yet rewarding nature of these interactions creates a calming experience. For individuals who cannot own real pets due to financial, health, or logistical constraints, virtual alternatives can offer similar companionship and emotional fulfillment. These games simulate the psychological benefits of real pet ownership, such as alleviating loneliness and providing a structured sense of responsibility. Studies and community discussions highlight how this connection improves players’ mental health, serving as a digital form of pet therapy. By offering a blend of escapism and companionship, virtual pet games position themselves as more than just entertainment—they become a source of emotional support.

Source: VirtualPetList – What’s the Impact of Virtual Pets on our Mental Health

Community Building and Social Interaction
The social dimensions of virtual pet games further distinguish them in the gaming landscape. Many of these games incorporate multiplayer or community-driven elements, such as trading pets, participating in competitions, or joining forums to share tips and stories. These social mechanics create opportunities for players to connect, fostering a sense of community around shared interests. Unlike games focused solely on individual progression, mascot-based games often emphasize collaboration and collective achievements. This interconnectedness enhances the experience, as players not only bond with their pets but also with like-minded individuals. These communities are not just secondary features; they often become the heart of the game, reinforcing player loyalty and encouraging long-term engagement.

Source: TheGamingList – Why do you play virtual pet games

Differentiation from Non-Pet Games
Games without virtual pet mechanics often focus on external goals, such as achieving high scores, completing missions, or mastering complex challenges. While these elements offer excitement and intellectual stimulation, they may lack the depth of personal connection that mascot gameplay provides. The act of nurturing a virtual pet introduces a softer, more empathetic dimension to gaming. It shifts the focus from external achievement to the internal satisfaction of caring for another being. This emotional engagement can make mascot games feel more rewarding over time, as the gratification stems from the player’s relationship with their pet rather than the completion of isolated tasks. In this way, mascot games stand out by blending emotional fulfillment with gameplay mechanics, offering a unique hybrid experience.

Conclusion

Mascot-based games with virtual pets differentiate themselves by fostering emotional bonds, enabling personalization, and offering psychological benefits that traditional games often lack. The cited research and community insights emphasize the importance of emotional engagement and responsibility in these games, which lead to increased empathy, reduced stress, and a greater sense of purpose. The integration of social features further enriches the gaming experience, creating communities that amplify the emotional connection between players and their pets. In contrast, games without virtual caregiving mechanics focus on external goals, which can limit their ability to resonate on a personal level. Ultimately, mascot gameplay is not just about entertainment—it’s about creating meaningful, enduring experiences that connect players to their virtual companions and to one another.