#04 Impact of Loneliness on Health

Social connection and satisfying relationships are fundamental for development, reproduction and survival. The impact of social influences on health and well-being has been extensively investigated through diverse scientific methodologies like epidemiological studies, network analyses, clinical trials and controlled experiments. Consistent evidence indicates that loneliness and social isolation negatively affect mental, physical, and cognitive health, with the most compelling findings linking these factors to an increased risk of premature mortality. 1 Several meta-analyses find that the risk of all-cause mortality is increased by 26 %. Moreover, these findings were consistent across various factors, including age, gender, cause of death, country of origin, and baseline health status 

Existing research makes a difference in all-cause mortality and cause-specific mortality, particularly when talking about cardiovascular diseases or strokes. All-cause mortality refers to the collective risk of death from all conditions associated with loneliness, while cause-specific mortality focuses on the risk of dying from a specific condition closely linked to loneliness or social isolation. 

Research has explored the individual and combined effects of loneliness and social isolation on mortality risk. While both factors independently correlate with higher mortality, studies suggest that social isolation is the stronger predictor when both are analyzed together. For example, some studies show that only social isolation remained significant after controlling for demographic, socio-economic, and health factors. 3 Beller and Wagner observed that loneliness and social isolation interact synergistically: greater social isolation amplifies the impact of loneliness on mortality, while higher loneliness intensifies the effect of social isolation. 4

The impact of social relationships on mortality risk can be compared to other well-established lifestyle risk factors like physical activity, alcohol consumption, smoking cigarettes, air pollution or obesity. 5
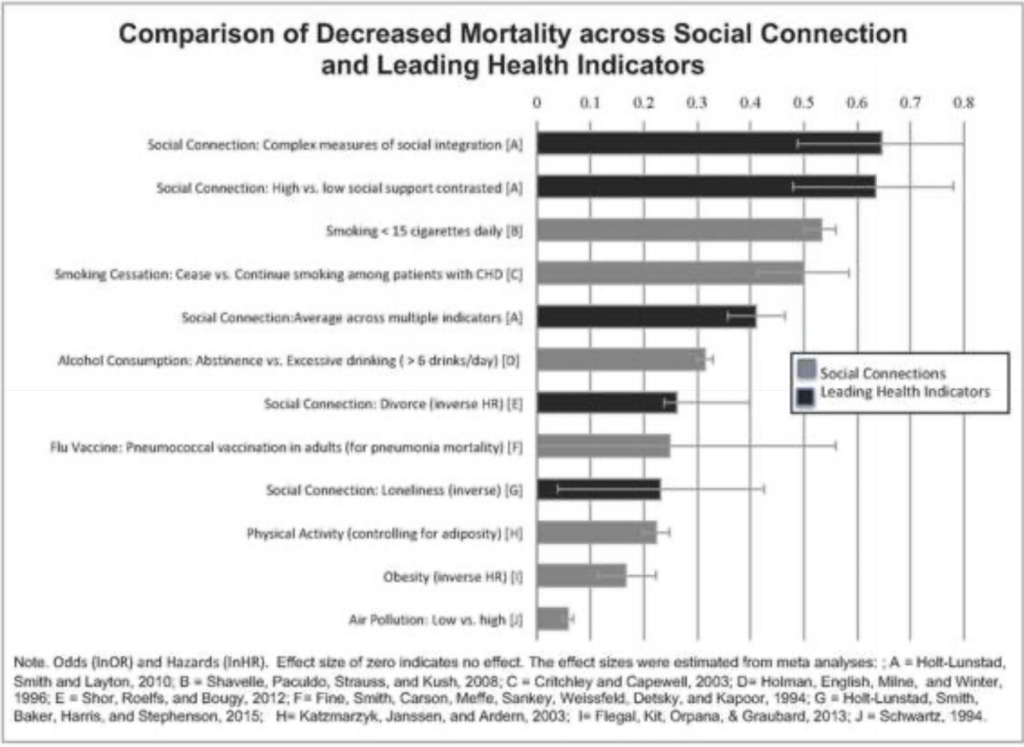
Comparison of Decreased Mortality across social connection and leading health indicators 3

Physical health

In addition to their association with increased mortality risk, social isolation and loneliness are linked to various health issues, including cardiovascular diseases, stroke, functional decline, and, to some extent, reduced immune function and diabetes. 3

Cardiovascular diseases
Cardiovascular diseases include diseases affecting the heart or blood vessels like heart attacks or strokes. A meta-analysis which is based on 23 different studies shows that loneliness and social isolation are linked to a 29 % higher risk of coronary heart disease and a 32 % higher risk of stroke. These associations were observed in both genders and remained significant regardless of traditional heart disease risk factors. Studies show that loneliness is linked to an increased risk of high blood pressure, particularly among middle-aged and older adults, and inflammatory reactivity. 3

Functional and motor decline
Loneliness is linked to increased functional and motor decline, including greater difficulty with activities of daily living and reduced muscle strength, mobility, and motor performance. 6 It remains unclear whether loneliness contributes to functional decline directly or indirectly through processes like cardiovascular diseases or inflammation. 

Diabetes and cholesterol
Few studies have linked loneliness to developing diabetes for men. A cross-sectional study in Switzerland shows that lonely people have a 40 % higher chance of developing diabetes and 31 % higher chance to have higher cholesterol levels. 8

Cognitive Health

Cognitive function encompasses a range of mental processes that enable an individual to acquire knowledge, reason, and carry out plans. These processes include perception, memory, learning, attention, decision-making, and language skills. 9

Cognitive decline
Several studies have explored the relationship between loneliness and/or social isolation, and cognitive decline, especially in older adults. Even though some studies show a link between loneliness and cognitive decline, they cannot agree on what part of the cognitive function is affected. 3

Alzheimer’s and Dementia
Most evidence suggests a correlation between loneliness and dementia, comparable to the other dementia risk factors like physical activity, low education and late-life-depression. 10 While a study from 2018 found no association between loneliness and dementia, there are other studies showing that there is a link between loneliness and developing dementia. To address the potential problem of reversed causality – where early-stage dementia leads to difficulties engaging in social interactions and therefore people feeling lonely – the study doesn’t include people in those early stages. 3

Mental health

A wide range of literature shows a significant relationship between loneliness and mental health issues like depression and anxiety as well as suicide and suicidal ideations. 3

Depression and Anxiety
Lonely individuals tend to experience more depressive symptoms and report being less happy, less satisfied, and more pessimistic. Additionally, loneliness and depression share common features, such as feelings of helplessness and emotional pain. 11 Another study also shows an association between poor social connection and social anxiety in both adolescents and adults. 1

Suicide and Suicidal Ideation
Studies indicate a connection between loneliness and suicide. A study of individuals who have attempted suicide found that loneliness is frequently cited as a contributing factor. 12

Taking loneliness seriously

Research shows that loneliness affects health, but the relationship is also bidirectional – some health conditions such as poor physical health, disabilities, or hearing loss, can also increase the likelihood of loneliness. The reported evidence highlights that loneliness should be taken more seriously as a risk factor for various health problems. 3


Sources

[1] J. Holt-Lunstad und Department of Psychology, Brigham Young University, Provo, Utah, USA, „Social Connection as a Public Health Issue: The Evidence and a Systemic Framework for Prioritizing the “Social” in Social Determinants of Health“, 2022. [Online]. Verfügbar unter: https://doi.org/10.1146/annurev-publhealth-052020-110732

[2] J. Holt-Lunstad, T. B. Smith, M. Baker, T. Harris, and D. Stephenson, “Loneliness and social isolation as risk factors for mortality: A meta-analytic review,” *Perspect. Psychol. Sci.*, vol. 10, no. 2, pp. 227–237, Mar. 2015, doi: 10.1177/1745691614568352. PMID: 25910392.

[3] J. Baarck, M. Kovacic und Joint Research Centre (JRC), „The Relationship between Loneliness and Health“, Publications Office of the European Union, literature review, 2022. doi: 10.2760/90915.

[4] J. Beller and A. Wagner, “Loneliness, social isolation, their synergistic interaction, and mortality,” Health Psychol., vol. 37, no. 9, pp. 808–813, Sep. 2018, doi: 10.1037/hea0000605. PMID: 30138019.

[5] J. Holt-Lunstad, T. F. Robles und D. A. Sbarra, „Advancing social connection as a public health priority in the United States.“, American Psychologist, Bd. 72, Nr. 6, S. 517–530, Sep. 2017, doi: 10.1037/amp0000103.

[6] K. Beaton and K. Grimmer, “Tools that assess functional decline: systematic literature review update,” Clin. Interv. Aging, vol. 8, pp. 485–494, 2013. Available at: https://doi.org/10.2147/CIA.S42528.

[7] A. S. Buchman et al., “Loneliness and the rate of motor decline in old age: the Rush Memory and Aging Project, a community-based cohort study,” BMC Geriatr., vol. 10, no. 1, p. 77, 2010. Available at: https://doi.org/10.1186/1471-2318-10-77. 

[8] R. A. Richard, S. Rohrmann, C. L. Vandeleur, M. Schmid, J. Barth, and M. Eichholzer, “Loneliness is adversely associated with physical and mental health and lifestyle factors: Results from a Swiss national survey,” PLoS One, vol. 12, no. 7, p. e0181442, Jul. 2017, doi: 10.1371/journal.pone.0181442. PMID: 28715478; PMCID: PMC5513556.

[9] K. Kiely, “Cognitive function,” in Encyclopedia of Quality of Life and Well-Being Research, A. C. Michalos, Ed., Dordrecht: Springer Netherlands, 2014, pp. 483–484. Available at: https://doi.org/10.1007/978-94-007-0753-5_2939.

[10] J. S. Kuiper, M. Zuidersma, R. C. Oude Voshaar, S. U. Zuidema, E. R. van den Heuvel, R. P. Stolk, and N. Smidt, “Social relationships and risk of dementia: A systematic review and meta-analysis of longitudinal cohort studies,” Ageing Res. Rev., vol. 22, pp. 39–57, Jul. 2015, doi: 10.1016/j.arr.2015.04.006. PMID: 25956016. 

[11] R. Mushtaq, S. Shoib, T. Shah und S. Mushtaq, „Relationship Between Loneliness, Psychiatric Disorders and Physical Health ? A Review on the Psychological Aspects of Loneliness“, JOURNAL OF CLINICAL AND DIAGNOSTIC RESEARCH, Jan. 2014, doi: 10.7860/jcdr/2014/10077.4828.

[12] L. M. Heinrich, E. Gullone und School of Psychology, Psychiatry, and Psychological Medicine, Faculty of Medicine, Nursing, and Health Sciences, Monash University, VIC 3800, Australia, „The clinical significance of loneliness: A literature review“, 2006. [Online]. Verfügbar unter: https://doi.org/10.1016/j.cpr.2006.04.002
The Role of Technology in Advancing Sustainable Graphic Design

Introduction

Technological advancements have transformed graphic design, providing tools and methods that align with sustainability goals. From energy-efficient software to blockchain for transparent supply chains, technology empowers designers to create impactful solutions while minimizing environmental harm. This post explores how emerging technologies support sustainable practices and inspire innovative approaches in graphic design.

Key Technologies Driving Sustainable Graphic Design

  1. AI-Powered Design Tools
    Artificial intelligence (AI) enables designers to optimize resources and streamline workflows. Tools like generative design systems can analyze environmental data to suggest the most resource-efficient layouts or materials. For instance, AI can recommend lighter fonts and colors for digital designs.
  2. Blockchain for Transparency
    Blockchain technology enhances traceability across supply chains, ensuring that materials are sourced ethically and sustainably. Designers can use blockchain to verify the origins of materials like FSC-certified paper or soy-based inks. This transparency fosters trust and accountability, as highlighted in Jedlicka’s Packaging Sustainability (2011).
  3. Energy-Efficient Software and Cloud Computing
    Design tools like Adobe Creative Cloud are increasingly optimized for energy efficiency, while cloud-based systems reduce the need for energy-intensive hardware. By hosting projects on green-certified servers, designers can lower their digital carbon footprint. The Green Web Foundation provides resources for identifying eco-friendly hosting services.
  4. 3D Printing for Prototyping
    As mentioned in Cradle to Cradle (McDonough & Braungart, 2002), reducing waste during production is a key sustainability goal. 3D printing allows for precise prototyping with minimal material waste, supporting sustainable packaging and product design.
  5. Digital Twins and Simulations
    Digital twin technology creates virtual models of designs, allowing designers to test environmental impacts before production. This reduces physical prototyping needs and streamlines the lifecycle assessment process.

Practical Applications in Graphic Design

  1. Sustainable Branding Projects
    Use AI tools to evaluate the environmental impact of branding elements such as logos, typography, and packaging.
  2. Eco-Friendly Packaging Design
    Combine blockchain verification and 3D printing to create transparent, sustainable and customized packaging solutions.
  3. Green Digital Marketing Campaigns
    Master energy-efficient software to create lightweight websites, interactive media, and AR experiences that align with green principles.

Challenges and Opportunities

While technology provides numerous advantages, it also poses challenges:

  • Access and Costs: Advanced tools like AI and blockchain may require significant investment, making them less accessible to small studios or freelance designers.
  • Learning Curve: Adopting new technologies often involves training and adaptation, which can slow workflows initially.
  • Ethical Use of Technology: Designers must ensure that technologies themselves are sustainably sourced and operated.

Despite these challenges, the opportunities for innovation, efficiency, and environmental impact reduction make technology a cornerstone of sustainable graphic design. As technology continues to evolve, its integration with sustainable graphic design will only deepen. Designers must stay informed and adaptable to these innovations.

References

  • Dougherty, B. (2008). Green graphic design. Allworth Press.
  • Jedlicka, W. (2011). Packaging sustainability: Tools, systems, and strategies for innovative package design. Wiley.
  • McDonough, W., & Braungart, M. (2002). Cradle to cradle: Remaking the way we make things. North Point Press.

#01 How ecocentric design can help us coexist with nature

Topic and objective

This research is about the need for systemic change to combat environmental crises, emphasising that functioning ecosystems are essential for life and climate resilience. The research seeks to investigate how ecocentric philosophies, particularly those rooted in sustainable land use, can inspire innovative design interventions that support large-scale ecological restoration.

This investigation objective is to propose an analysis on the role design can play in addressing the interconnected crises of climate change and biodiversity loss. I also want to explore how ecocentric design principles can foster coexistence with nature by integrating approaches like permaculture and regenerative farming into scalable solutions.


Background

Today we stand in front of a huge task of saving the world. We are currently in the midst of a nature and climate crisis. Since 1970, two-thirds of the world’s wildlife populations have declined, and there has never been a more urgent need to restore damaged ecosystems than now (Almond et.al. 2022). We know that functioning ecosystems are essential for all life on Earth, since nature acts as a buffer against climate change.

We are less resilient to climate changes the less intact nature we have. Though trying to combat both these crisises, we see that they are intertwined in ways that makes change very difficult (Det Norske Vitenskapsakademi, 12:04). UN´s nature panel, IPBES range “changed areal usage” as the biggest threat to the biological diversity (NTNU Event, 2022, 7:50).

Why biodiversity is important – with Sir David Attenborough explaines some of the fundamentals on why we need to protect our nature.


Ecocentrism:

A worldview that sees all of nature as having inherent value, and is centred on nature rather than on humans. Also known as biocentrism. See anthropocentrism.


Research question: How ecocentric design can help us coexist with nature

The central research question driving the work is how ecocentric design principles can be used to promote coexistence with nature? This inquiry aims to bridge the gap between ecological theory and design strategies that empower individuals and communities to live in harmony with their environments.


How to solve it?

Trying to come up with solutions to these global problems is a tough job. It seems that we need deeprooted value change among the entire population. WWF writes in the Living Planet report 2022 that

It’s not too late for nature to recover, but we need big, bold solutions. Restoring nature will require unprecedented conservation efforts that meet the scale of the nature loss crisis, and an urgent transformation of our food, energy and finance systems. (Almond et.al. 2022)

WWF also lists these actions as the main solutions to these crisises:

  • TRANSFORMING CONSERVATION
  • TRANSFORMING OUR FOOD SYSTEM
  • TRANSFORMING OUR ENERGY SYSTEM
  • TRANSFORMING FINANCE

These are of course some very big systematical changes that I alone cannot take on by myself. Nevertheless, I aim to learn how I as a designer can contribute to these already existing movements.


When trying to explore some solutions on my own I have gotten an interest in topics like permaculture, regenerative farming, and sustainable land use. These are some of the more important areas that I think is crucial so learn about if I am to understand the interconnected problems.

Looking at possible solutions in the start, there are many different roads to go. For example, I could aim for an implementation framework that outlines actionable steps for integrating ecocentric practices into broader societal contexts. This solution is a very broad and vague one, but which also allows me to get the broad aspect early on, so I can dive deeper into a smaller and more defined area later in my anctual thesis.

Another possible solution is to explore how integrating approaches like permaculture and regenerative farming into scalable solutions. This could be looking at existing small-scale solutions (for example small sustainable communities) and see what can we learn from these and how to scale this up to be accessible for the greater societies.

Another way to go is to look in to existing methodology being used by cooperations with similar intentions on how to battle these huge societal problems. This could be to see how for example Green Peace, WWF, UN, NGOs, the different nations and even how political parties work with communication, value change, spreading knowledge and actually making a positive impact. This approach to my researching could help me navigate in this very broad theme – as well as giving me tools to learn more and more efficient.


The road and challenges ahead

As described above, my motivation for this theme is my personal desire to work against the interconnected crises of climate change and biodiversity loss – and learn as much as possible about what can be done. I believe that design is a powerful tool that can play a big part in the solution. This is what I aim to find out in this research.

The main challenges ahead that I can see is that I tend to go extremely broad in framing the problem – making the research task a very difficult one. Because of my desire to “save the whole world”, I find it difficult to close doors on themes and problems I find important. But since this topic is a very large and interconnected one – my main task in the start will be to narrow it down to a tangible amount I can work with. Another challenge is to work alone, whereas I have found working in groups much better – where I can spar and discuss with others.

If enough people realise that we have influence and can make an impact in this very big world, we can make actual change. Though I must admit that I also feel lost, scared and hopeless when facing such a wicked problem, I hope that through this research, I will be able to gain more knowledge and confidence – and restore hope that we will be able to turn our course to a better one.


Sources

Almond, R.E.A., Grooten, M., Juffe Bignoli, D. & Petersen, T. (Eds). WWF, Gland, Switzerland. (2022). Living Planet Report 2022 – Building a nature- positive society. WWF https://media.wwf.no/assets/attachments/lpr_2022_full_report_2023-02-09-115529_ahtx.pdf?_gl=1*16u778x*_up*MQ.._gaNjA1MTQ4ODUxLjE3MTQ2NTM5MTQ._ga_BB7Z1P8XYMMTcxNDY1MzkxNC4xLjAuMTcxNDY1MzkxNC4wLjAuMA

Det Norske Vitenskapsakademi (12:04) Dag O. Hessen [Video]. Youtube. Hvorfor kan vi ikke ofre naturen for det grønne skiftet? https://www.youtube.com/watch?v=rOa2GFtmfu8

NTNU Event (2022, 16th of August). Hvem bestemmer over norsk natur? – Arendalsuka 2022 [Video]. Youtube. https://www.youtube.com/watch?v=j16EJiCrxSA

Permaculture Research Institute (2024) What is Permaculture? https://www.permaculturenews.org/what-is-permaculture/

The Royal Society (11th Oct., 2021) Why is biodiversity important – with Sir David Attenborough. Youtube. https://www.youtube.com/watch?v=GlWNuzrqe7U&t=5s

Lets talk about Design

Wie bereits im Artikel “Chronologisches Storytelling auf Web-Plattformen” unter Fallbeispiele angeführt, möchte ich ein Erlebnis schaffen, dass komplett auf die zu erzählende Geschichte abgestimmt ist und möglichst innovative und sinnvolle Interaktionsmöglichkeiten schaffen. Wie bei der ÖBB das Ticket ziehen oder bei der Ukraine Seite der switch zwischen Russlands Ansicht vs. Rest der Welt (ob das jetzt in dem Fall die Wahrheit ist oder nicht, sei mal dahingestellt).

Folgende Faktoren gehören somit beim erstellen des UX/UI Designs beachtet.

Geschichtenbasiertes Design (Storytelling im Fokus)

Die Benutzeroberfläche muss die Geschichte unterstützen und verstärken. Elemente wie interaktive Zeitleisten, animierte Übergänge oder thematische Illustrationen sollten die Narration visuell und emotional unterstützen. Der inhaltliche Fluss sollte logisch und nachvollziehbar sein, um die Geschichte effektiv zu erzählen.

Interaktionsmöglichkeiten

Interaktionen sollten die Geschichte vertiefen und den Benutzer aktiv einbinden. Beispiele sind Drag-and-Drop-Elemente, Scrolling, interaktive Karten, 360°-Ansichten oder vergleichende Schaltflächen wie bei der Ukraine-Seite (Russlands Ansicht vs. Rest der Welt). Die Interaktionen müssen intuitiv und selbsterklärend sein, um Frustration zu vermeiden.

Emotionale Ansprache

Farben, Schriftarten, Bilder und Animationen sollten so gewählt werden, dass sie die emotionale Wirkung der Geschichte verstärken. Mikrointeraktionen wie Animationen bei Klicks oder Hover-Zuständen können subtile, aber wirksame Effekte schaffen.

Barrierefreiheit und Inklusion (Accessibility)

Das Design muss barrierefrei gestaltet werden, sodass es auch für Menschen mit Einschränkungen zugänglich ist (z. B. Screenreader-Kompatibilität, Tastaturnavigation, ausreichende Farbkontraste). Texte und Beschriftungen sollten klar lesbar und verständlich sein.

Mobile-First-Ansatz und Responsivität

Da viele Benutzer über mobile Geräte auf die Plattform zugreifen, muss das Design auf Smartphones, Tablets und Desktops gleichermaßen gut funktionieren. Interaktive Elemente müssen für Touchscreens optimiert sein, beispielsweise durch größere Schaltflächen.

Visuelle Kohärenz und Konsistenz

Alle visuellen Elemente, wie Farben, Schriften und Icons, sollten einem konsistenten Designsystem folgen. Dies schafft ein harmonisches Nutzererlebnis. Thematische Anpassungen, die zur Geschichte passen, wie spezifische Farbpaletten oder gestalterische Details, sind dabei wichtig.

Benutzerführung (User Flow)

Der Benutzerfluss sollte so gestaltet werden, dass die Navigation durch die Geschichte klar und mühelos erfolgt. Orientierungshilfen wie Fortschrittsanzeigen oder “Zurück”-Schaltflächen können helfen, den Kontext zu wahren.

Nutzerfeedback und Testing

Prototypen sollten regelmäßig getestet werden, um sicherzustellen, dass das Design sowohl funktional als auch narrativ überzeugt. Nutzerfeedback ist entscheidend, um Schwachstellen in der Navigation oder Interaktion zu erkennen und zu beheben.

Beispiele:

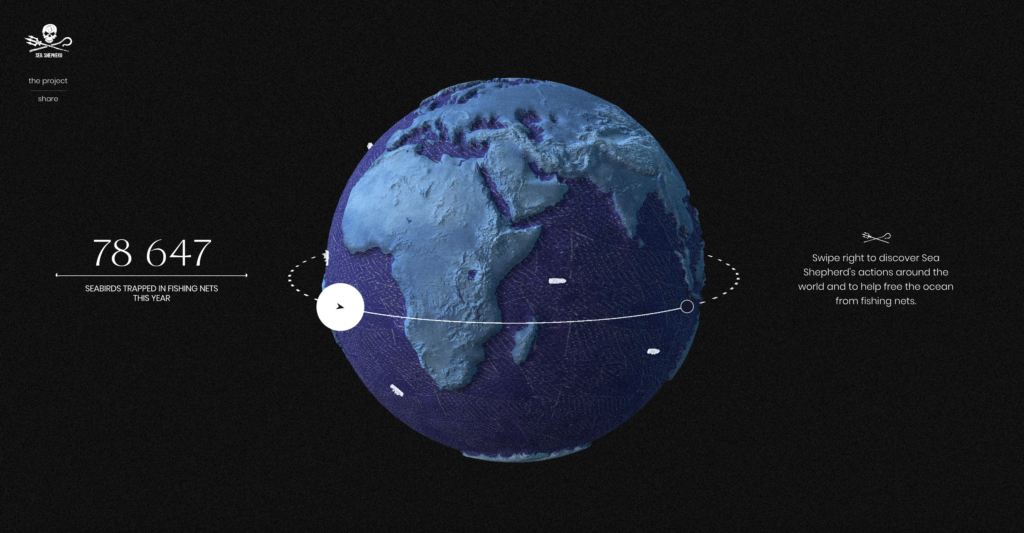
https://www.no-fishing.net

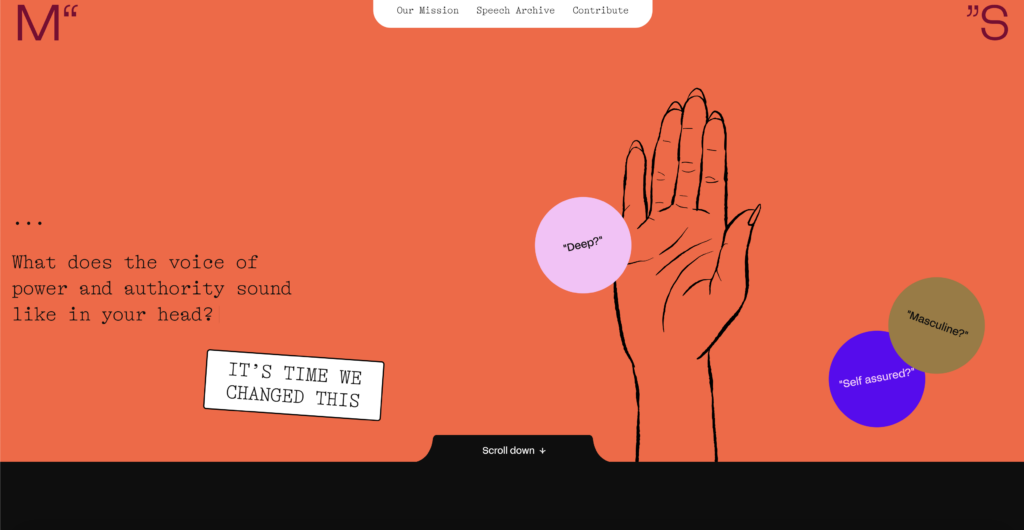
https://madamspeaker.org.au

https://storytime.xyzal.com/story/the-sleepy-wizard

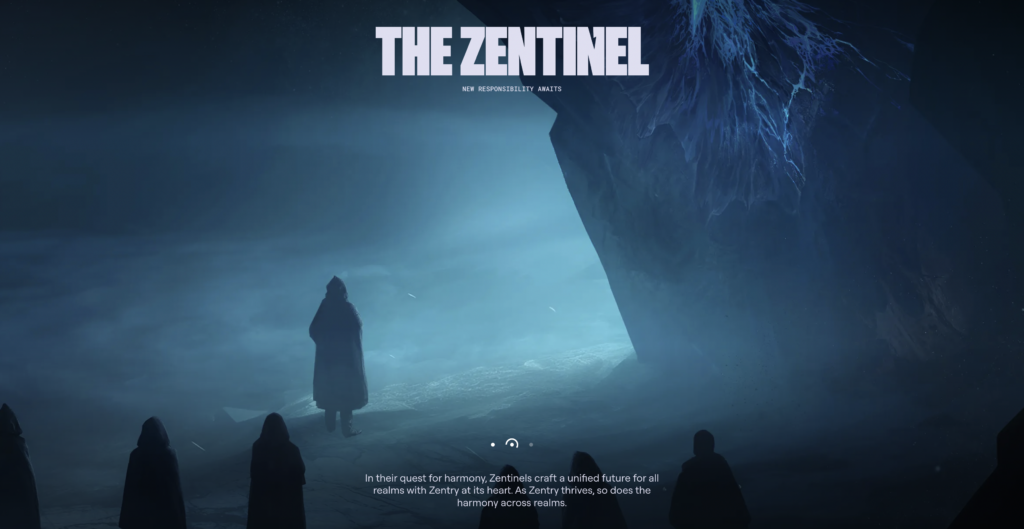
https://zentry.com/prologue

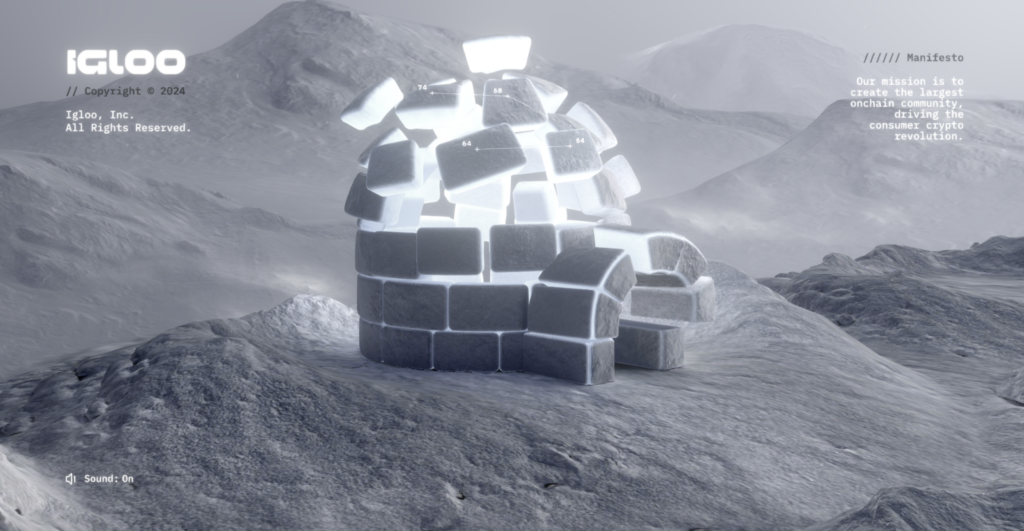
https://www.igloo.inc

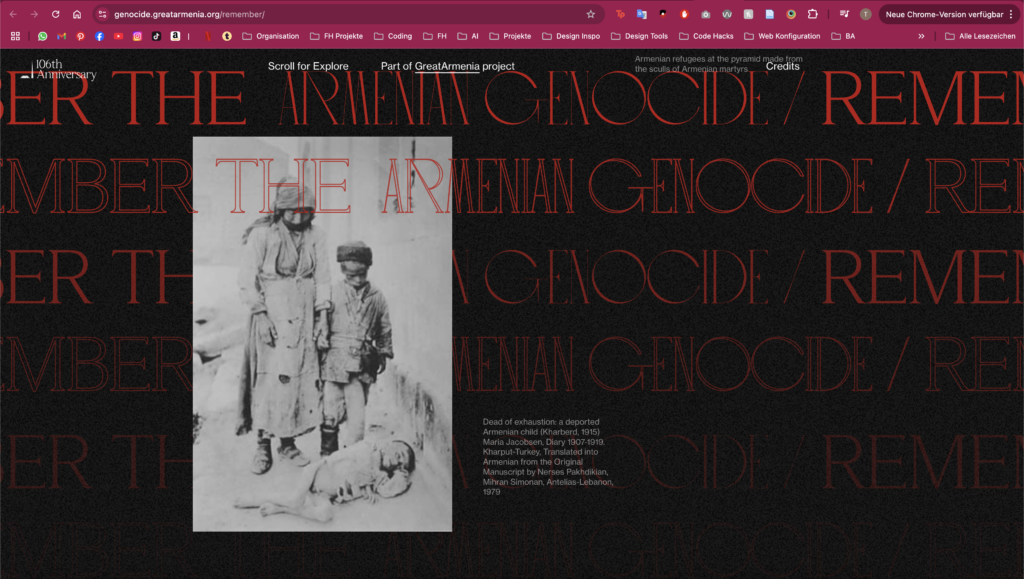
https://genocide.greatarmenia.org/remember

Digital Biopic?

Bisher habe ich es mir noch offen gelassen, ob es eine digitale Galerie über mehrere Künstler:innen wird, die dort quasi ihre eigene Subpage bekommen, oder ob ich eine spezielle Geschichte aufbereite. Momentan tendiere ich dazu, eine repräsentative Geschichte zu finden und diese dafür umso detaillierter aufzubereiten und auch in der Nachforschung/Recherche jemanden besonders relevanten zu finden.

Besonders inspiriert wurde ich da von Filmen wie “Big Eye” oder Arte Dokumentationen über einzelne Schicksale der Künster:innen (hauptsächlich aber Frauen). Im Vergleich dieser beiden herangehensweisen an Verfilmung: “Big Eye” ist ein Biopic (kurz für “biographical picture”) – ein Filmgenre, das auf dem Leben einer realen Person basiert und Arte Dokus im klassischen Dokumentarstil/manchmal reenacted, finde ich Biopics immer viel mitreisender und emotionaler. Biopics haben nicht den Anspruch, komplett Realitätsgetreu zu sein, sondern mehr einen spannenden Dramaturgischen Bogen zu machen, während Dokumentationen natürlich die Wahrheit abbilden sollen. Ich will in meiner Arbeit natürlich auch nur die Wahrheit zeigen, diesen Teil übernehme ich von der Dokumentation, aber will mit den interaktiven Animationen auch schaffen, dass die User ein unterhaltendes Erlebnis erfahren können, wie es bei einem Biopic der Fall ist.

Darum kurze Stichwort Recherche, wie man den Begriff “Biopic” in der Webbranche übersetzen könnte:

  • Digital Biography
  • Interactive Biopic
  • Digital Memorial
  • Immersive Biography
  • Narrative Web Documentary

Beispiele für Narrative Web Dokus:

http://hollowdocumentary.com/
Ist schon eher alt und nicht die modernste Technologie, aber der Mix aus verschiedenen Medien und auch Sounds und Zahlen die sich erhöhen + der tragischen Geschichte ergibt ein sehr eindrucksvolles Projekt.

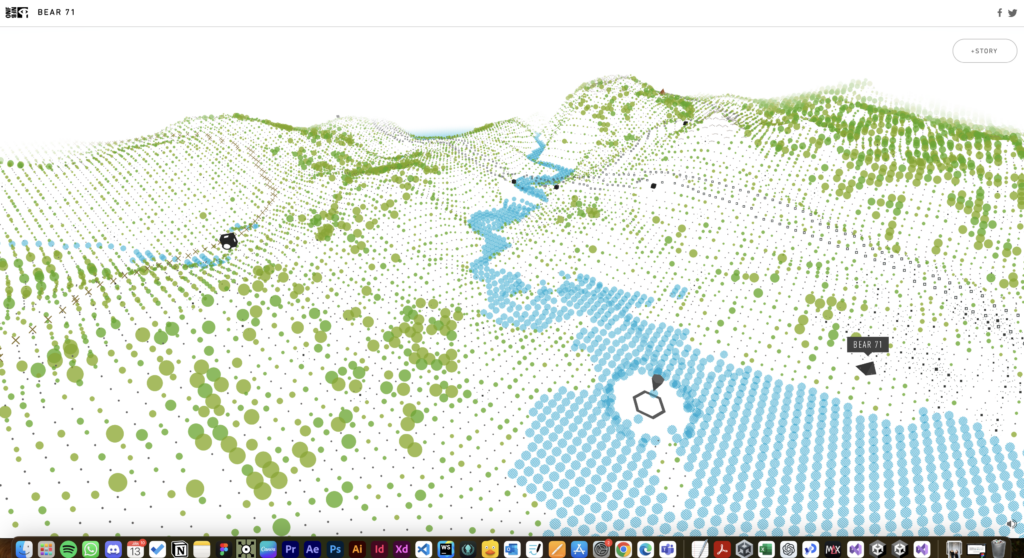
https://bear71vr.nfb.ca

Wilde Geschichte über die Vertreibung des Tierreichs durch Menschen in Kanada aus der Ich-Perspektive von Bear 71 erzählt.

Auf der AWWWARDS Webseite gibt es eine Subkategorie namens “Non Profit Websites”, in der es viele Beispiele gibt, die auch Mehrheitlich durch Storytelling versuchen, auf einen Missstand oder ein Problem aufmerksam zu machen.

https://www.awwwards.com/awwwards/collections/nonprofit-websites

Loneliness – a quick overview

„The loneliness epidemic“ – a buzzword that has been coming up more and more in recent years. It seems to be an increasingly relevant topic, which is quite interesting and somewhat paradox, considering the parallel increase of innovative technology for creating connections between millions of people, no matter the time of day or location on the planet. However, something seems to be wrong. Reports show that around a third of the population of industrialized countries are affected by loneliness [1]. The group most affected by loneliness are young adults between 16 and 24 [5] and what is even more concerning – this number has been rising over the past few years [6]. The WHO has even declared loneliness a global public health concern in 2023 and launched and international commission to study the problem [2]. How can loneliness be such a prominent topic and increasing issue, when we are more connected than ever? This makes for an interesting research topic in which I will be asking the question of how interaction design can combat loneliness.

First of all, to better understand the topic of loneliness, the term has to be defined and differentiated from similar ones such as aloneness, solitude and social isolation, as these mean slightly different things. Aloneness and social isolation describe qualitative, objective measures in which an individual has no one around them. More subjective measures include solitude and loneliness. While solitude describes a feeling of voluntary aloneness, which is mostly a positive experience, loneliness is the opposite and describes a negative experience of the state of being alone [3]. There is no one definition of what loneliness is exactly, generally it is agreed that it can be described as the subjective discrepancy between an individual’s existing versus desired social relationships [1]. When looked at more closely, loneliness can be further categorized into three types. Social loneliness means the feeling of isolation from a social network or community. Simply put: the missing sense of belonging. Emotional loneliness describes the sense of lacking close, intimate, emotional connections. Finally, existential loneliness refers to a deeper inner feeling of being fundamentally alone in life. Further categorizations include transient, situational and chronic loneliness [3].

Since loneliness is for the most part a subjective feeling, it can be quite tricky to measure it for studies and observation. One of the most prominent attempts to measure loneliness is the UCLA loneliness scale which has bee revised several times and works like a relatively simple questionnaire [4].

Loneliness has a significant impact on mental and physical health. It can contribute, as well as cause depression. This vicious cycle has a high risk of increasing early mortality. With depression being the most common mental health issue, loneliness is a topic that should not be overlooked, since they are often intertwined [7]. Loneliness can also harm the body physically. Diabetes, autoimmune disorders, cardiovascular diseases, obesity, physiological aging, cancer, poor hearing and overall poor health have been found to be caused by loneliness [1,7]. Addressing loneliness could be an important step in the battle against the mental health crisis and improvement of physical wellbeing.
Besides mental and physical health loneliness can even impact the economy. Poorer work performance and lower educational attainment have been associated with loneliness and its accompanying symptoms. This is estimated to cost employers millions per year due to employee sickness, caring activity, productivity, and voluntary staff turnover [8].

It is clear that we need to better understand the loneliness epidemic in order to work on solutions that bring us together.


Sources

  1. C. Park et al., „The Effect of Loneliness on Distinct Health Outcomes: A Comprehensive Review and Meta-Analysis“, December 2020, doi: https://doi.org/10.1016/j.psychres.2020.113514
  2. „WHO Commission on Social Connection“, World Health Organization [Online], Available: https://www.who.int/groups/commission-on-social-connection, Accessed: December 2024
  3. „Definitions of lonely, isolated, alone, and solitude“, what works wellbeing, [Online], Available: https://whatworkswellbeing.org/resources/definitions-of-lonely-isolated-alone-and-solitude/, Accessed: December 2024
  4. D. Russell, UCL Loneliness Scale, Fetzer Institute, Available: https://fetzer.org/sites/default/files/images/stories/pdf/selfmeasures/Self_Measures_for_Loneliness_and_Interpersonal_Problems_UCLA_LONELINESS.pdf
  5. „16 to 24 year olds are the loneliest generation“, UKOnward, Available: https://www.ukonward.com/data/how-often-do-you-feel-lonely/, Accessed: January 2025
  6. „Community Life Survey 2023/24: Loneliness and support networks“, gov.uk, Available: https://www.gov.uk/government/statistics/community-life-survey-202324-annual-publication/community-life-survey-202324-loneliness-and-support-networks–2, December 2024
  7. R. Mushtaq, „Relationship Between Loneliness, Psychiatric Disorders and Physical Health ? A Review on the Psychological Aspects of Loneliness“, September 2014, doi: 10.7860/JCDR/2014/10077.4828
  8. Campaign to End Loneliness, “Facts and Statistics – Campaign to end loneliness,” Campaign to End Loneliness, May 10, 2024. https://www.campaigntoendloneliness.org/facts-and-statistics/

Interaction Design, Loneliness and Public Spaces

In an increasingly urbanized and digital world, public spaces are no longer the main place for community and interaction they once were. However, while global connectedness has rapidly increased thanks to modern technology, smartphones and social media many people, despite being surrounded by others, feel disconnected, isolated and lonely. Public spaces, like parks, libraries, and cafés, have always served as places where people come together. But as our lives become more fast-paced and technology-driven, these spaces are not the first choice for seeking connection, with most digital online solutions being more convenient and accessible.

I find the paradox of a rapidly evolving world, where global connectedness and interaction are increasing, yet loneliness is at an all-time high, to be a fascinating premise. It is a topic that – at least to a certain degree – almost everyone is affected by, and understanding what differentiates different kinds of interaction and connection (e.g. online and face to face) will only become more important in the future, especially for interaction designers. I see designing connection and interaction as an important starting point to tackling many different societal issues, loneliness being only one of them.

Interaction design is the practice of designing the way people interact with technology, environments, and most importantly: each other. It therefore offers the potential to rethink how public spaces function. By creating interactive experiences, design can invite people to slow down, engage with their surroundings, and connect with others in creative and meaningful ways.
With the increasing issue of loneliness, the principles of interaction design and the potential of public spaces I want to ask and aim to answer the question how design can combat loneliness by reshaping the way we interact in public spaces.

When diving deeper into the topic of loneliness, several sub-questions arise for further exploration and understanding. To tackle loneliness at its core, it is important to understand what loneliness is exactly and what the root causes are. These foundational questions help define the phenomenon and uncover why it emerges in various contexts. The effects should also be looked at more closely, posing questions such as: What does loneliness do to us? – physically, emotionally, and socially. Especially when it comes to exploring and developing possible solutions exploring the flip side, will be important. Questions like What is connection? How do we connect? and examining the mechanisms of building (meaningful) bonds are important. Researching on a broader scale, learning about basic human needs and how communities are built is another important aspect that should be considered.

More specific topics for interaction design could include reimagining third spaces like parks or cafes to encourage interactions, designing interactive and participatory experiences, or developing digital platforms that prioritize meaningful engagement over superficial connections. Additionally, incorporating haptic and sensory elements, such as touch-based installations or shared experiences, can evoke a stronger feeling of presence and connection. It’s essential to ask whether the spaces we design truly foster connection, and whether technological connectedness actually equals connection – fulfilling our need to be understood and supported. 
Some interesting ideas for design spaces with connection and community in mind have already been implemented. In many cities, including Graz, places like „Repair Cafés“ [1] can be found. These are spaces where people can not only fix their broken items, but also socialize, connect and learn from each other. “Maggie Centers” [2] provide a place for people affected by cancer in which they can come together, talk, connect and bond over workshops and activities.

It is important to keep in mind that loneliness is a very large and hard to grasp topic. There is existing research, however the approaches and understanding of the topic still vary. Even a general consensus on how to define the term itself hasn’t been found. It can mean different things to different people and it can have various root causes, which means a solution could look very different for many people. An interesting approach could therefore be focusing on human needs in terms of social connection, belonging and purpose, which are things that directly contrast loneliness. When working on possible solutions it is important to keep in mind that there is no one cure, since loneliness as well as connection are complex and deeply personal.

In the upcoming blogposts, I will explore the broader topic of loneliness, connection, and community to gain a solid understanding and foundation of the topic. From there, I will investigate more specific elements of the research question by taking a look at spaces and environments that foster social interaction, such as third and fourth spaces, as well as principles of designing for connection and belonging. I will also look at case studies and examples of successful design interventions to draw inspiration. This journey will ideally give valuable insights and opportunities for addressing loneliness through thoughtful and intentional interaction design.


Repair Café: https://www.repaircafe-graz.at/
Maggie Centers: https://www.maggies.org/our-centres/
The UK has recently launched a campaign to end loneliness: https://www.campaigntoendloneliness.org/
The loneliness lab is a global collective of people and organizations on a mission to design connection: https://www.lonelinesslab.org/

Technische Challenges

In der konkreten Umsetzung meines Projektes bzw. des Prototypen der wissenschaftlichen Arbeit geht es um eine Web-Anwendung, die mittels Animationen, gutem Storytelling und interaktiven Benutzermöglichkeiten zu einem immersiven User Erlebnis verhelfen soll. Durch diese spielerische Informationsaufnahme soll vor allem ein emotionaler Zugang zu den bereitgestellten Informationen gegeben werden.

Aus technischer Sicht gibt es dafür einige Aspekte zu berücksichtigen

Framework: Die Grundlage für die Entwicklung

Die Wahl eines geeigneten Frameworks ist entscheidend, um die Entwicklungszeit zu optimieren und die technischen Anforderungen zu erfüllen. Die Auswahl hängt von verschiedenen Faktoren ab:

React, Vue oder Svelte?
React bietet eine breite Community und Bibliotheken wie Three.js für 3D-Animationen und GSAP für Animationseffekte. Vue und Svelte hingegen punkten mit ihrer Einfachheit, was für interaktive Anwendungen von Vorteil sein kann.

Backend-Integration
Wenn die Web-App serverseitige Datenverarbeitung oder Benutzerverwaltung benötigen würde, könnte ein Framework wie Next.js (auf React basierend) oder Nuxt.js (für Vue) sinnvoll sein. Diese ermöglichen serverseitiges Rendering (SSR) und verbessern so die Performance und SEO.
Da aber nur ich die Webseite betreibe und es höchstwahrscheinlich auch keine Content-Änderungen für Redakteure oder andere User geben wird, ist es schon wahrscheinlich, dass ich gar kein backend anbinde. Könnte, falls später mal nötig, auch ganz easy angebunden werden.

WebGL-Integration
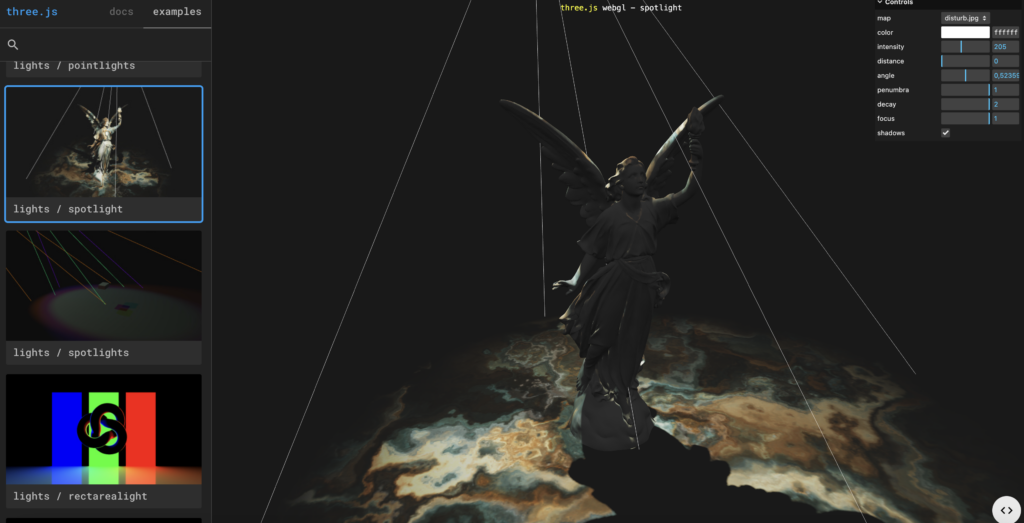
Für 3D-Inhalte und Animationen ist die Integration von WebGL unumgänglich. Frameworks wie Three.js bieten hier gute Tools, die mit JavaScript-Frameworks kombiniert werden können. Ich bin mir zwar noch nicht sicher, ob ich 3D Elemente einbinde, aber falls ja, dann würde ich mich gerne im Thema Three.js fortbilden.

https://threejs.org/examples/#webgl_lights_spotlight


Animationen: Performance und Flexibilität

Animationen spielen eine zentrale Rolle im Projekt, um das Storytelling lebendig zu gestalten. Dabei sind folgende technische Anforderungen zu beachten:

Tools wie GSAP oder Lottie
GSAP (GreenSock Animation Platform) ist eine bekannte Bibliothek für detaillierte und performante Animationen. Lottie ermöglicht das Einbinden von Animationen, die direkt in Tools wie After Effects erstellt werden.

Optimierung der Performance
Animationen können die Ladezeit und Performance der Web-App stark beeinflussen. Lazy Loading und die Minimierung der Größe von Assets sind hier essenziell.

Responsive Animationen
Die Animationen müssen auf unterschiedlichen Bildschirmgrößen und Geräten gleich gut funktionieren. Media Queries und relative Maßeinheiten spielen hierbei eine wichtige Rolle.


Interaktivität: Benutzerfreundliche Elemente

Eine interaktive Web-App erfordert robuste und intuitive Interaktionselemente:

Event Listener
Interaktionen wie Mausbewegungen, Scroll-Events oder Touch-Gesten müssen richtig und performant umgesetzt werden.

State Management
Bibliotheken wie Redux (React) oder Pinia (Vue) können helfen, den Zustand der App konsistent zu verwalten, insbesondere bei komplexen Interaktionsmöglichkeiten.

Barrierefreiheit (Accessibility)
Damit alle Benutzer Zugang zu den Inhalten haben, muss die Anwendung barrierefrei gestaltet werden. Dies umfasst Tastatursteuerung, Screenreader-Kompatibilität und gut lesbare Kontraste. Insbesondere bei Web-Anwendungen, die durch Interaktion hervorstechen, kommt die Berrierefreiheit oft zu kurz. Hier besonders viel Zeit einplanen.


Datenverarbeitung und Backend

Falls, wie oben bereits beschrieben, überhaupt ein Backend nötig ist, dann sind folgende überlegungen zu tätigen:

Content Management System (CMS)
Da kein voll Umfangreiches Backend nötig ist, kann für eine einfache Verwaltung der Inhalte ein Headless CMS wie Strapi, Sanity oder Contentful integriert werden.

Datenbanksystem
Falls größere Datenmengen gespeichert werden, könnten relationale (z. B. PostgreSQL) oder NoSQL-Datenbanken (z. B. MongoDB) benötigt werden.


Herausforderungen bei der Performance

Eine immersive Web-Anwendung mit Animationen und Interaktivität kann ressourcen-intensiv sein. Daher ist die Optimierung der Performance essenziell:

Code Splitting und Lazy Loading
Inhalte und Animationen sollten nur bei Bedarf geladen werden, um die Ladezeit zu verkürzen.

Bild- und Asset-Optimierung
Alle Bilder und Medien sollten in modernen Formaten wie WebP gespeichert und komprimiert werden.

Browserkompatibilität
Die Anwendung muss auf allen gängigen Browsern und Plattformen stabil laufen. Testing-Tools wie BrowserStack oder CrossBrowserTesting sind hier hilfreich.


Quellen:

https://joshcollinsworth.com/blog/introducing-svelte-comparing-with-react-vue

https://reactjs.org/docs/getting-started.html

https://vuejs.org/guide/extras/render-function.html

https://spin.atomicobject.com/animations-threejs-gsap/

https://frontend.horse/episode/using-threejs-with-gsap-scrolltrigger

01. #07 What makes a typeface reader-friendly?

The choice of font plays a crucial role in how effectively and comfortably text can be read, particularly by beginners. For children learning to read, certain typographic features and design principles are essential to support their early literacy journey.

Typographic Characteristics
Serifs vs. Sans-Serifs
Fonts without serifs are often preferred for early readers because they have simpler shapes that are easier to distinguish. Serif fonts, with their small decorative strokes, can sometimes confuse young learners. Clear distinctions between letters such as b and d or p and q help minimize confusion. Fonts designed for early readers should avoid ambiguous letter shapes. For example, the lowercase l should not look like the numeral 1.

x-Height
The x-height, or the height of lowercase letters relative to uppercase letters, significantly affects readability. Fonts with a larger x-height are generally easier for early readers to process, as they provide clear differentiation between similar-looking characters (e.g., a and o).

Letter Spacing
Adequate spacing between letters (kerning) ensures that characters do not blur together. This is particularly important for children who are still developing their visual discrimination skills.

Consistent Stroke Width
Fonts with consistent stroke widths are easier for children to decode compared to fonts with dramatic variations.

Fonts that are visually appealing and tailored to children’s preferences, such as playful or colorful designs, can make reading feel like a fun and engaging activity. Reader-friendly fonts help reduce errors and misunderstandings, boosting children’s confidence and encouraging them to keep practicing.

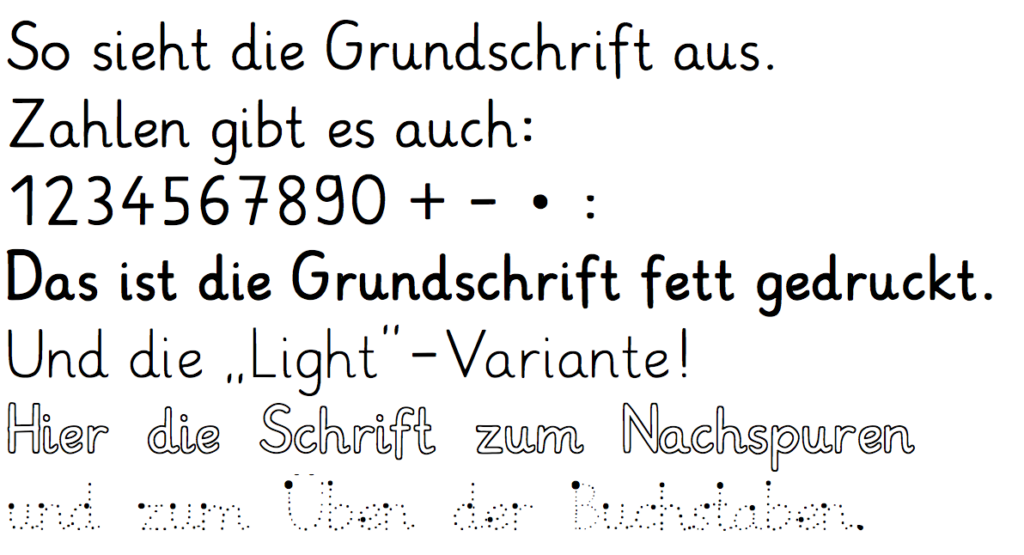
Grundschrift is designed to mimic handwriting, providing children with a natural transition between printed text and their own writing. It features clear, simple letterforms with sufficient spacing and a focus on uniformity.

The Power of Data Visualization: Turning Numbers into Insight

Thinking of my project and the first meeting, the main and big problem is how data must be visualized to help people understand it. It seems so simple but most of the data gets lost in the dark because people don’t know what to do with them. Data visualization is another form of visual art that grabs our interest and keeps our eyes on the message. It’s storytelling with a purpose.

Data visualization is the graphical representation of information and data. It uses visual elements like charts, graphs, and maps to provide an accessible way to see and understand trends, outliers, and patterns in data. By presenting data visually, it transforms complex datasets into a more digestible and meaningful format, allowing stakeholders to grasp key insights quickly. 

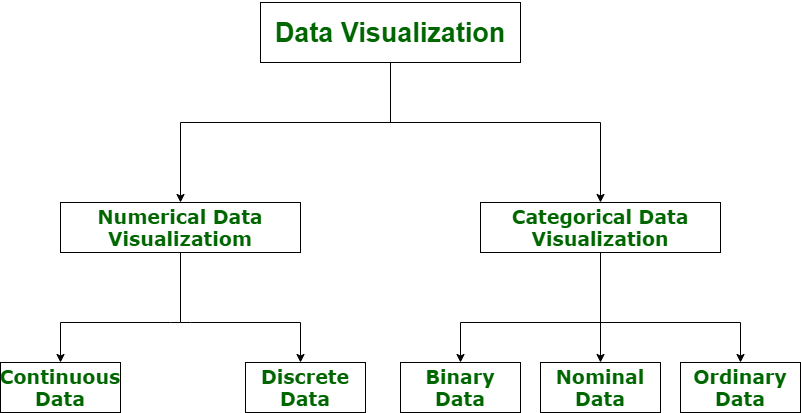
It’s important to visualize data accurately when you’re doing market research. This is because you can visualize both numerical and categorical data, which makes the insights more impactful and reduces the risk of analysis paralysis.

What is the Goal of Data Visualization? 

The primary goal of data visualization is to communicate data clearly and efficiently. It aims to make complex data more understandable, uncover hidden insights, and facilitate better decision-making. Visualization bridges the gap between raw data and actionable intelligence, helping users to process information faster and make data-driven decisions. 

Why is Data Visualization Important? 

In the world of Big Data, it’s really important to be able to see all that data in a way that makes sense in order of being able to make data-driven decisions. The primary goal of data visualization is to communicate data clearly and efficiently. It provides an accessible way to see and understand trends, outliers, and patterns in data and a way for experts in a specific field to present data to non-technical audiences without confusion.

In today’s data-rich environment, data visualization is crucial for several reasons. It enhances understanding by making complex datasets more accessible through visual representation. This improved clarity supports better decision-making, allowing for quicker and more informed choices by highlighting key data points and trends. Additionally, data visualization aids in communication, effectively conveying information to diverse audiences, including non-technical stakeholders. Lastly, it helps identify patterns and trends that might not be immediately apparent in raw data, enabling organizations to uncover valuable insights.

What Types of Data Visualization Are There? 

There are various types of data visualizations, each suited to different kinds of data and analysis goals: 

  • Chart: Displays information in a graphical form with data along two axes. Types include graphs, diagrams, and maps.
  • Table: Presents figures in rows and columns, useful for detailed data comparison.
  • Graph: A diagram showing relationships between variables, often along two axes.
  • Geospatial: Uses maps to show data relationships with specific locations, employing shapes and colors.
  • Infographic: Combines visuals and text to represent data, often with charts or diagrams.
  • Dashboards: A collection of visualizations for comprehensive data analysis and presentation in one place.
  • Area Map: Shows values over geographical locations, such as choropleths and isopleths.
  • Bar Chart: Uses bars to represent numerical values for easy comparison.

Choosing the Right Data Visualization

Choosing the right data visualization depends on the type of data and the story you want to tell. Factors to consider include the nature of your data (quantitative vs. qualitative), the relationship between data points, and the key message or insight you want to convey. Charts, graphs, and maps serve different purposes and cater to diverse analytical needs, from showing comparisons and trends to highlighting distributions and relationships.


So the bigger purpose of Data visualization is not just about making data look good; it’s about making data more accessible and actionable. By effectively employing various visualization techniques, professionals can transform how data is interpreted and utilized across industries. 

There are a lot of tools to that can help visualization Data like: Google Charts, Tableau, Grafana, Chartist, FusionCharts, Datawrapper, Infogram, and ChartBlocks. In the course of my work with the Risklim team, I will also have to deal with such tools to see how we can work better with the available data. 

Reference

https://www.tableau.com/visualization/what-is-data-visualization#:~:text=Data%20visualization%20is%20the%20graphical,outliers%2C%20and%20patterns%20in%20data. 12.01.25, 21:37

https://www.geeksforgeeks.org/data-visualization-and-its-importance 12.01.25, 21:24

https://www.atlassian.com/data/charts/how-to-choose-data-visualization 12.01.25, 21:57