Blog Post 4: Exploring IoT in Retail

IoT for Retail Applications

2.1 Real-Time Inventory Management

One of the most impactful uses of IoT in retail is real-time inventory tracking. Traditionally, stores rely on manual checks or clunky barcode systems that are time-consuming and prone to error. With IoT:

• RFID Tags: Clothing retailer Zara has widely adopted RFID tags to automate inventory counts, reducing out-of-stock situations and improving shelf availability. Store employees can wave an RFID reader over a rack and instantly know which sizes and colors need replenishing.

• Beacons: Placed strategically in aisles, these small devices automatically detect and log inventory data. They also help store staff locate products or direct customers to specific items. In some supermarkets, beacons linked to a mobile app can alert staff to low inventory in high-demand sections (e.g., bottled water during a heatwave).

Case Study: Walmart

Walmart has been testing “smart shelves” in multiple locations. These shelves use weight sensors and RFID tags to monitor product levels. When an item runs low, the system automatically alerts staff (or even dispatches autonomous robots) to restock. The result is fewer stockouts and a smoother shopping experience.

2.2 Personalized Marketing & Customer Engagement

IoT enables hyper-personalized shopper experiences. By integrating beacons, apps, and loyalty programs, retailers can tailor offers to each customer’s location and preferences.

• Beacon-Triggered Notifications: Large department stores like Macy’s in the U.S. have experimented with beacon technology to send special deals or product suggestions to a shopper’s phone as they pass specific sections, like cosmetics or footwear.

• Loyalty Programs: Grocery chains in Asia, such as Aeon in Japan, have started integrating location-based offers with loyalty apps. When a customer walks into a store, the app can highlight discounts on items they frequently purchase. This not only increases sales but also makes the customer feel valued and understood.

Case Study: Starbucks

While not strictly an in-store beacon case, Starbucks has embraced IoT in a broader sense. Its mobile app tracks buying patterns and uses location data to offer personalized drink recommendations, birthday perks, and seasonal promotions in real time. This data-driven approach is integral to Starbucks’ loyalty strategy, encouraging customers to keep coming back for more.

Technical Stack

3.1 Hardware

  1. Sensors & RFID Readers

These form the backbone of inventory management. Sensors gauge environmental variables (like temperature for fresh produce), while RFID readers help quickly scan multiple items at once—unlike barcodes, which require line-of-sight scanning.

  1. Beacons

These low-energy Bluetooth transmitters can detect when a smartphone (with a compatible app) is near. Retailers use beacons to send location-based messages or gather foot-traffic data to improve store layouts.

  1. Gateways & Routers

A gateway device collects data from local sensors (via Bluetooth or Wi-Fi) and sends it to the cloud. Strong, consistent network coverage is essential for seamless data transfer—especially in large spaces like shopping malls or warehouses.

3.2 Software

  1. Cloud Services

Platforms like AWS IoT, Microsoft Azure IoT, or Google Cloud IoT provide secure data storage, real-time analytics, and integration with AI/ML tools. Retailers can mine this data for patterns—like the best times to run flash sales.

  1. Data Analytics Platforms

Tools such as Tableau or Microsoft Power BI create dashboards that visualize complex data sets. Managers can view store performance metrics—like foot traffic, average dwell time in aisles, or inventory turnover—in a user-friendly format.

  1. Mobile Applications

These can be customer-facing (e.g., a rewards app that receives beacon alerts) or staff-facing (e.g., an in-store inventory management app). App design heavily influences how effectively IoT data translates into real-world actions.

Global Case Studies

ISA: Connected Refrigeration Units

Background

• ISA, an Italian manufacturer of commercial refrigeration and display cabinets, needed to connect its units worldwide for predictive maintenance and energy efficiency insights.

• Telenor Connexion provided a managed connectivity solution to ensure each refrigeration unit stayed online and shared data from any global location.

Challenges

• Energy consumption of commercial refrigeration is a significant cost. Early detection of malfunctioning parts is critical to prevent spoilage.

• Manual data logging of temperatures is time-consuming and prone to human error.

• ISA’s clients demand minimal downtime and a solid Service Level Agreement (SLA).

IoT Solution & Results

• Sensors & Cloud Connectivity: Digital and analog sensors in ISA’s cabinets monitor temperature, humidity, and performance metrics, uploading data via mobile networks.

• Predictive Maintenance: When temperatures rise beyond a certain threshold, service teams get an immediate alert. This reduces food spoilage risks and minimizes maintenance costs by targeting problems in real time.

• Global Rollout: Telenor’s global partner network allowed ISA to export connected units worldwide without region-specific connectivity hassles.

• Regulatory Compliance: Cloud-based data logs demonstrate consistent temperature ranges, aiding in certification and legal compliance.

Key Takeaway

For retailers selling perishable goods—like gelato or produce—a robust IoT framework similar to ISA’s can lead to significant cost savings and a more reliable customer experience.

Carpigiani: IoT-Enabled Gelato Machines

Background

• Carpigiani, also based in Italy, manufactures over 10,000 ice cream machines annually for international clients—from local shops to major fast-food chains.

• Carpigiani partnered with Telenor Connexion in 2010 to implement a global managed connectivity solution.

Challenges

• Managing different connectivity suppliers in each country became unwieldy as Carpigiani expanded globally.

• They required a single global SIM solution that could function across 400+ mobile networks worldwide.

IoT Solution & Results

• Unified Global SIM: Carpigiani can deploy the same connectivity solution no matter where a machine is sold or installed.

• Data Analytics: Sensors within each machine send data (e.g., usage rates, component stress, temperature) to the cloud for analysis.

• Optimized Maintenance: Carpigiani reduced service costs by scheduling maintenance based on actual usage rather than fixed time intervals—repairing parts right before they might fail.

• Remote Monitoring (Teorema System): A specialized platform allows engineers to track machine performance remotely, performing software updates and diagnosing issues without costly on-site visits.

Key Takeaway

Retailers selling or operating machinery (ice cream machines, coffee machines, etc.) can adopt a similar approach to extend product lifecycles, lower operational costs, and offer better service warranties.

Ningbo Sanxing Smart Electric: Next-Gen Smart Meters

Background

• Sanxing, headquartered in China, provides intelligent power distribution solutions, including smart meters and transformers.

• In Q4 2020, a major Scandinavian energy supplier chose Sanxing to supply new smart meters—supported by Telenor Connexion—to align with Sweden’s next-generation smart grid requirements.

Challenges

• Sweden’s population is spread out, meaning the new metering infrastructure must handle both urban and remote areas seamlessly.

• Existing meters needed to be upgraded for higher data accuracy, more detailed reporting, and two-way communication capabilities.

IoT Solution & Results

• Flexible, Scalable Connectivity: Telenor’s solution ensures reliable connectivity—even in remote areas—so meters can exchange data in real time.

• Detailed Energy Insights: Consumers receive granular data on their electricity use, enabling better energy management and cost savings.

• Future-Proof Architecture: The system can integrate more data points (like water or gas usage) down the line, supporting the utility company’s digital roadmap.

Key Takeaway

Although this case lies outside traditional retail, it demonstrates how scaling IoT infrastructure in large and geographically varied markets requires flexible connectivity and robust data analytics. Retailers with multiple warehouse or store locations (including rural areas) should note the importance of reliable connectivity for consistent IoT performance.

OTOY: VR-Based Data Visualization

Background

• OTOY, a California-based company, specializes in 3D rendering and virtual reality technologies.

• Rather than using traditional spreadsheets or static dashboards, OTOY creates immersive simulations that let stakeholders visualize and interact with data in real time.

Application to IoT

• Enhanced Simulations: By pulling detailed, real-time data from IoT sensors (for instance, atmospheric conditions, mechanical stress points), OTOY can create ultra-realistic VR models of buildings, products, or environments.

• Real-World Performance Testing: Architects, designers, and product managers can virtually “test” how an object or building will fare under certain wind speeds, temperatures, or usage patterns.

Potential for Retail

• Store Layout Simulations: Imagine a VR environment that replicates foot traffic patterns from real IoT data, allowing store planners to fine-tune product placement before any physical changes.

• Product Demos: Furniture or appliance retailers could let customers walk through a realistic VR environment, see how a product fits in a virtual home, and gather performance data from integrated sensors.

Key Takeaway

OTOY’s work indicates that IoT data visualization can go beyond simple graphs to create immersive, interactive experiences—a potential game-changer for retail store design, product previews, and customer engagement.

Practical Lessons for Retailers

  1. Predictive Maintenance Translates to Predictive Retail

• Just as Carpigiani schedules machine maintenance right before parts fail, retailers can anticipate product reorders, identify declining equipment performance (e.g., POS terminals, store HVAC systems), and avoid downtime.

  1. Global Connectivity Is Key

• Whether it’s machines in multiple countries or chain stores across diverse regions, a single connectivity solution can unify data gathering and analysis. Partnerships with global IoT providers streamline deployments.

  1. Leveraging Big Data for Compliance & ROI

• ISA leveraged real-time data logs to meet food safety standards, while Sanxing provided detailed usage reports for energy regulation. In retail, similar data can aid in sustainability compliance, waste reduction, and targeted marketing.

  1. Immersive Visualization as a Next Step

• Tools like OTOY hint at the future: combining IoT data with VR/AR to model store layouts or product usage scenarios in a highly interactive way. Retailers adopting AR-based product previews (furniture, cosmetics try-ons, etc.) are already moving in this direction.

  1. Scalability & Security

• As you scale, ensure robust data security measures (encryption, secure cloud architecture) to protect customer data and prevent breaches. IoT trust is essential for long-term adoption.
Blog Post 3: User Research

User Research

Exploring User Experience in Retail vs. Online Shopping**

This research was conducted under User Experience class at FH JOANNEUM with Dorota, Veronica, Leila, and me as part of the project. The research explores why users continue to shop in physical retail stores despite the convenience of online shopping. By understanding the user experience in both contexts, we hope to uncover insights that explain the different preferences and behaviors driving users to either shop online or visit retail stores. Results has help to see issues in both of the system and how improvements could be added.

Results of user research

Detailed Findings by Shopping Category

Groceries

In-Store: Young adults (18-30) enjoy in-store grocery shopping for freshness and social interaction, while older adults (45+) rely on trusted local stores to ensure quality.

Online: Urban professionals (25-40) occasionally use online grocery delivery for convenience. However, concerns about freshness and expiration deter many users, especially older ones.

Fashion and Apparel

Try-Before-Buy: Younger users (18-30) buy online from familiar brands to minimize sizing issues. Mid-age adults (30-50) prefer in-store shopping for special occasions, valuing easy return options.

Hybrid Approach: In cities like Moscow, many users browse in-store but purchase online for better deals, though return processes can be a hassle.

Electronics and Gadgets

Research Focus: Young professionals (25-35) rely on online reviews and comparisons before buying, while older users (60+) prefer in-store guidance from staff or family members.

Hybrid Purchases: Urban professionals favor online orders with in-store pickup to inspect products before finalizing.

Furniture and Home Decor

In-Store Preference: Older adults (50+) prefer in-person shopping to assess large items, while younger users (18-30) are comfortable buying smaller decor online if reviews are positive.

Online Challenges: Issues like color and size discrepancies lead some users to opt for in-store pickup.

Health and Beauty Products

Physical Try-On: Younger users buy familiar products online but prefer in-store for new items requiring texture or scent testing. Older adults (50+) trust in-store recommendations for health-related purchases.

Hobbies and Entertainment

Young Adults (18-30): Tend to discover and buy books, games, and sports equipment online due to broader selection and better deals. Social media and online reviews heavily influence their choices.

Older Users (60+): Prefer in-store shopping for hobbies, valuing personal recommendations and the ability to inspect items before buying, especially for gardening or reading.

Pain Points and Frustrations

Delivery and Return Processes

Urban Users (25-45): While Moscow and other large cities provide convenient delivery services, users voiced frustrations about the quality and reliability of some delivery services. Some participants noted that delivery providers failed to follow specific instructions, leading to missed deliveries or delays.

Return Complications: Across age groups, online returns were seen as cumbersome. Users preferred platforms with straightforward return policies or those offering in-store returns for items purchased online. Older users were especially deterred by the requirement to repackage items or arrange for pickup.

Social Influence and Trends

Younger Users (18-30): Heavily influenced by social media and online reviews, younger users were more likely to purchase products trending on platforms like Instagram or TikTok. This age group frequently turns to social media influencers and online reviews when exploring new brands or products.

Older Adults (45+): Social influence was less pronounced among older users, who relied more on personal experience, recommendations from family or friends, and in-store staff advice when making purchases.

Blog Post 2: Literature Research

Literature

1. Introduction

We are witnessing a technological revolution that is reshaping every aspect of commerce. Among the most transformative developments is the Internet of Things (IoT), a network of interconnected devices and sensors capable of gathering and sharing data in real time. According to Blair (2023), the retail sector has emerged as a fertile ground for IoT’s applications, leveraging these technologies to enhance customer engagement, optimize inventory management, and streamline operations. This post provides an overview of current literature and real-world examples—especially Amazon Go—to illustrate the impact, challenges, and solutions associated with IoT in retail.

Case Study: Amazon Go, Revolutionizing Retail with IoT

4.1 Background on Amazon Go

A notable example where IoT significantly shapes retail is Amazon Go—the checkout-free store concept first introduced to employees in December 2016 and later to the public in January 2018. While Amazon Go may not yet have achieved widespread market dominance, it remains a groundbreaking “Just Walk Out” approach that has inspired industry-wide discussions on the future of brick-and-mortar retail (Wingfield 2018).

4.2 Technology Stack

Amazon Go’s technology centers around a well-connected IoT ecosystem. Computer vision, sensor fusion, edge computing, and RFID tags work together to identify a shopper, track items taken from the shelves, and automatically update a virtual cart. This configuration effectively removes the need for traditional checkout processes, charging customers’ Amazon accounts once they exit the store (Maul 2022). From deep learning models to weight sensors on shelves, every aspect of the customer journey is monitored to create a frictionless in-store experience.

4.3 Benefits and Risks

• Benefits:

• Faster Checkout: Eliminates waiting times, enhances customer satisfaction.

• Operational Efficiency: Reduces labor costs by automating checkouts, and collects robust data on consumer shopping behaviors.

• Personalization: Data-driven insights help refine inventory decisions and shape marketing campaigns.

• Risks:

• High Initial Costs: Setting up advanced IoT infrastructure demands significant investment.

• Privacy Concerns: Biometric recognition and extensive data collection raise questions about consent and data protection.

• Technical Failures: Even minor system glitches can disrupt the customer experience and lead to negative publicity (Walton n.d.).

Challenges and Proposed Solutions

  1. Privacy and Security

• Challenge: Biometric and behavioral data collection introduces serious privacy issues.

• Solution: Amazon addresses these via data encryption and anonymization practices. Additionally, retailers must adopt transparent data policies and comply with frameworks like GDPR or CCPA.

  1. High Upfront Costs

• Challenge: IoT-based systems require substantial financial resources (hardware, software, R&D).

• Solution: View IoT as a long-term investment. Over time, efficiency gains (reduced labor costs, improved inventory control) may offset the initial expenditures.

  1. Technological Complexity

• Challenge: Implementing IoT requires advanced technical expertise, robust network infrastructures, and continual maintenance.

• Solution: Conduct pilot tests to refine hardware and software configurations. Partner with specialized firms offering IoT integration services, and ensure staff are well-trained.

Conclusion

Even though Amazon Go itself has faced some market hurdles—such as store closures—the broader literature emphasizes that IoT remains central to revolutionizing retail. Retailers who adopt IoT can achieve high operational efficiency, gain actionable insights on consumer behavior, and provide personalized experiences that increase customer loyalty. As the technology continues to evolve, so will the opportunities to seamlessly integrate digital and physical retail spaces.

Notably, Amazon’s approach to keeping financial details of Amazon Go confidential signals its focus on research and development. This underscores the notion that the company views IoT-based retail solutions as a long-term, data-driven investment capable of shaping the future of commerce. By monitoring—and in some cases, pioneering—these advancements, Amazon reinforces the belief that IoT is here to stay, driving innovation, efficiency, and customer-centric shopping experiences for years to come.

Data about commerce and internet usage

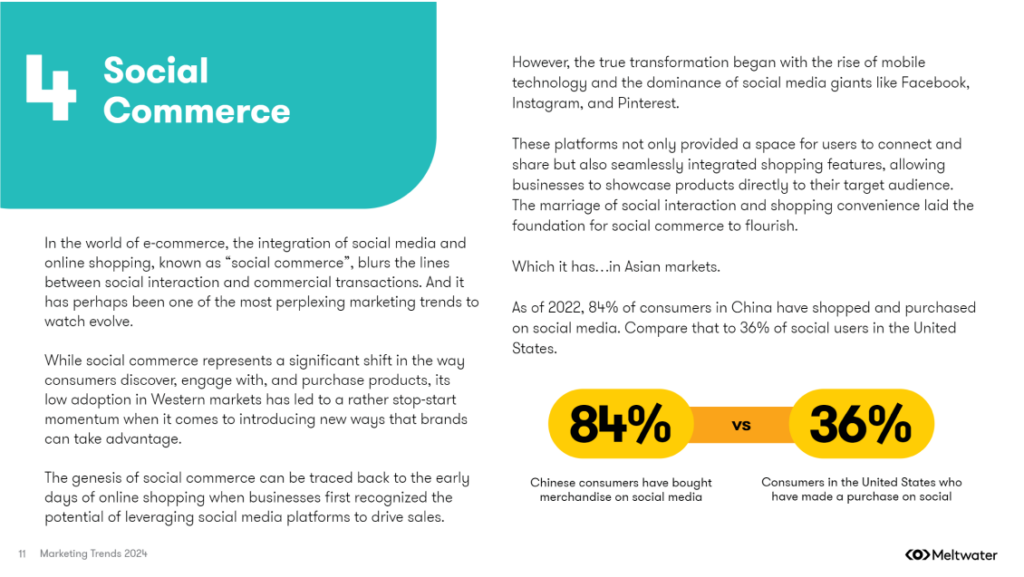
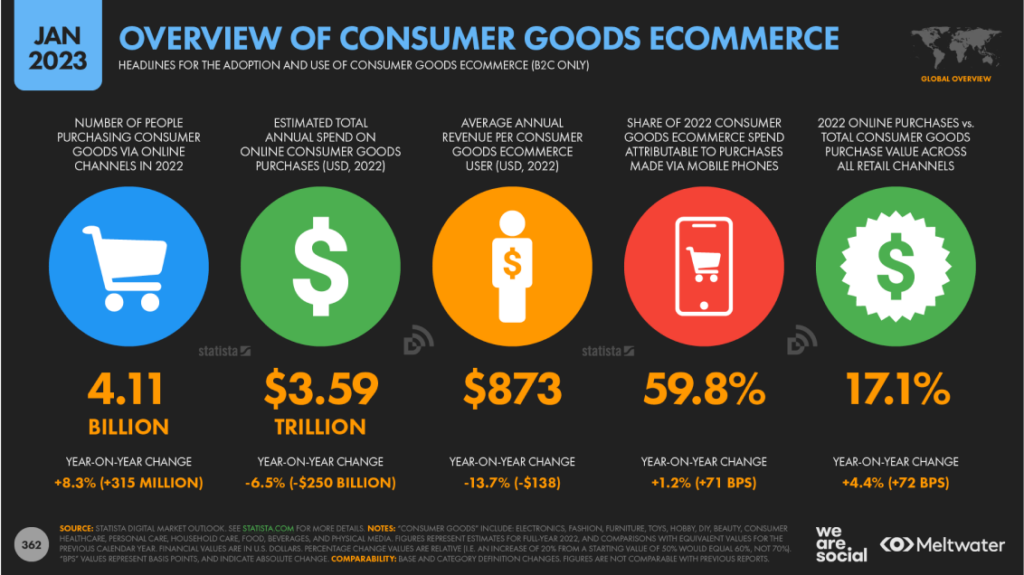
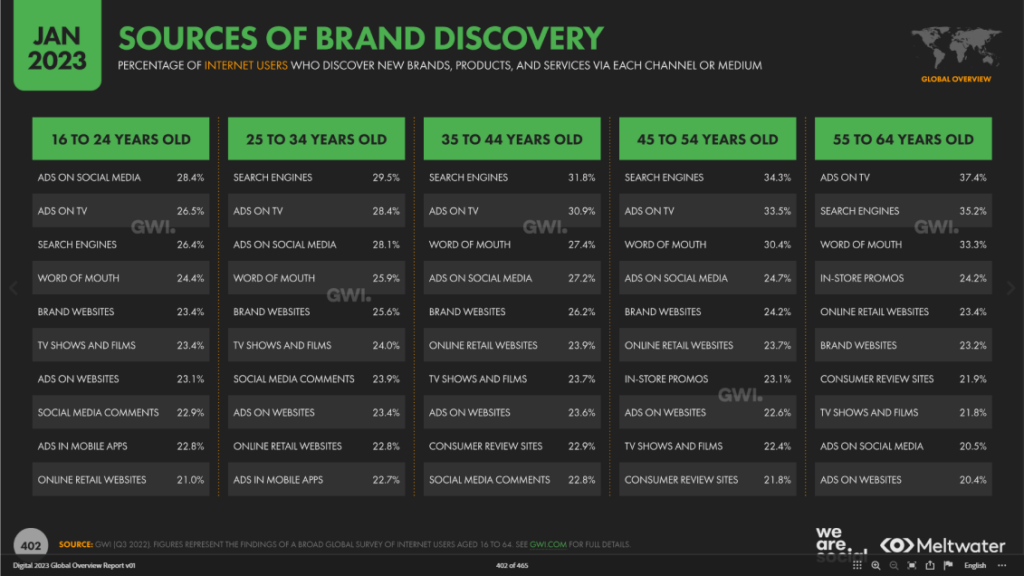
• Rising Mobile & Social Influences: As consumers spend more on mobile and discover brands via social networks, it’s critical to design shopping experiences that are seamless, engaging, and highly shareable.

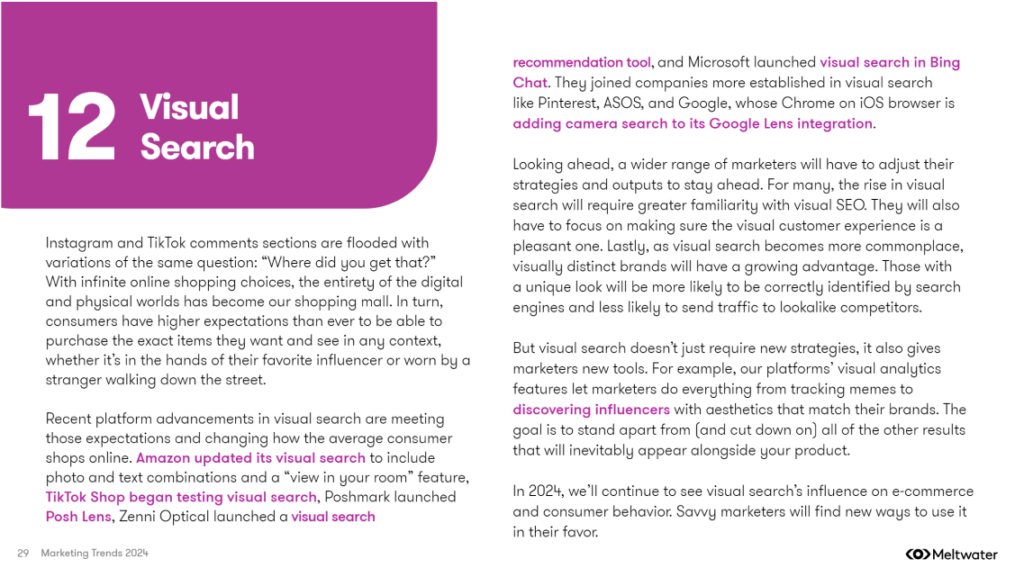
• Visual & AR Integrations: Visual search and augmented reality can reduce friction in product discovery and drive higher engagement. Researching how to integrate these tools effectively could yield valuable user insights.

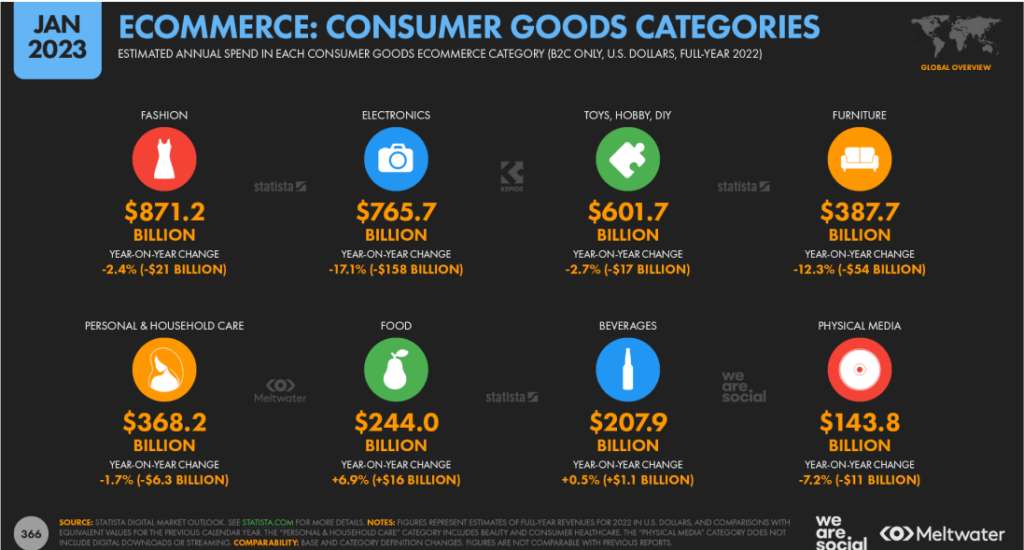
• Shifting Category Priorities: Essential categories (like food) are growing, while discretionary items (like electronics) show volatility. Studying consumer sentiment and economic factors can inform better product and UX strategies.

• Age-Based Differentiations: Different generations rely on different channels. Tailoring designs and content to these preferences can improve conversion rates.

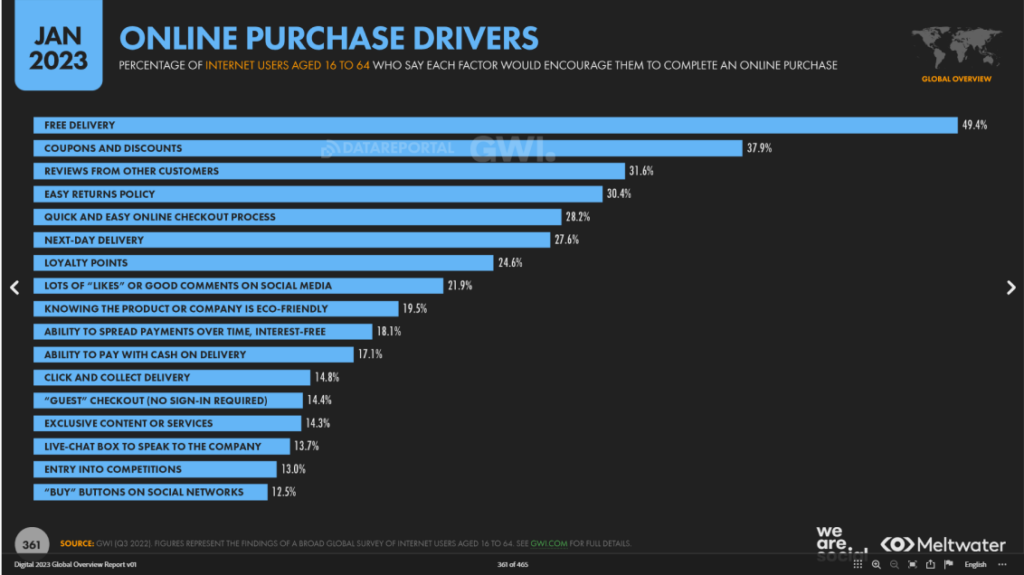
• Social Proof & Convenience: Free shipping, reviews, easy returns, and transparent eco-friendly practices remain top motivators. Integrating these features into the user journey can significantly impact purchase decisions.

e-commerce continues to evolve toward mobile- and social-centric experiences, with visual and interactive elements becoming key differentiators. By focusing on seamless user experiences, trust-building features, and strategic channel optimization, brands can align better with evolving consumer behaviors.

Level Up Your Gains: The Benefits of Mascot Based Gameplay

Games featuring mascot gameplay—where players nurture and care for virtual pets or similar characters—offer a distinct experience that sets them apart from games without such mechanics. These games tap into players’ emotional cores, creating bonds that extend beyond simple gameplay. This connection fosters unique engagement, often blending entertainment with emotional and psychological benefits. By exploring the dynamics of these games, we can better understand why they resonate so deeply with players.

Emotional Attachment and Responsibility
Caring for a virtual pet encourages players to build an emotional attachment through repetitive, nurturing interactions. These games simulate the experience of having a dependent creature, which naturally elicits feelings of responsibility. For instance, players may feed, groom, or play with their virtual companions, and neglecting these tasks can result in consequences like an unhappy or sick pet. This interplay of care and accountability fosters a sense of purpose and consistency in player behavior. Unlike traditional games, where engagement is tied to objectives like defeating enemies or solving puzzles, mascot gameplay intertwines success with the pet’s well-being. Research suggests this attachment can positively impact empathy and nurturing behaviors in real life, potentially making players more attuned to caring for others.

Source: SFU – The effects of interacting with a computer-simulated virtual pet dog on children’s empathy and humane attitudes

Enhanced Engagement through Personalization
Mascot gameplay frequently allows players to deeply personalize their virtual pets, which strengthens the emotional bond between the player and the game. Players often have the opportunity to name their pets, customize their appearances, and influence their behaviors or attributes through choices made in the game. This level of personalization fosters a sense of ownership and pride, transforming what could otherwise be a generic in-game character into something truly unique. This customization keeps players invested, as they are not simply progressing in the game but are actively building a relationship with a personalized entity. As a result, the more effort players put into shaping their pets, the more likely they are to stay engaged over time. By comparison, games without this level of customization may struggle to build similar levels of attachment or long-term engagement.

Stress Reduction and Mental Well-being
Interacting with virtual pets is not just entertaining—it can also have therapeutic benefits. Many players report feelings of relaxation and reduced stress while caring for their virtual companions, as the low-stakes yet rewarding nature of these interactions creates a calming experience. For individuals who cannot own real pets due to financial, health, or logistical constraints, virtual alternatives can offer similar companionship and emotional fulfillment. These games simulate the psychological benefits of real pet ownership, such as alleviating loneliness and providing a structured sense of responsibility. Studies and community discussions highlight how this connection improves players’ mental health, serving as a digital form of pet therapy. By offering a blend of escapism and companionship, virtual pet games position themselves as more than just entertainment—they become a source of emotional support.

Source: VirtualPetList – What’s the Impact of Virtual Pets on our Mental Health

Community Building and Social Interaction
The social dimensions of virtual pet games further distinguish them in the gaming landscape. Many of these games incorporate multiplayer or community-driven elements, such as trading pets, participating in competitions, or joining forums to share tips and stories. These social mechanics create opportunities for players to connect, fostering a sense of community around shared interests. Unlike games focused solely on individual progression, mascot-based games often emphasize collaboration and collective achievements. This interconnectedness enhances the experience, as players not only bond with their pets but also with like-minded individuals. These communities are not just secondary features; they often become the heart of the game, reinforcing player loyalty and encouraging long-term engagement.

Source: TheGamingList – Why do you play virtual pet games

Differentiation from Non-Pet Games
Games without virtual pet mechanics often focus on external goals, such as achieving high scores, completing missions, or mastering complex challenges. While these elements offer excitement and intellectual stimulation, they may lack the depth of personal connection that mascot gameplay provides. The act of nurturing a virtual pet introduces a softer, more empathetic dimension to gaming. It shifts the focus from external achievement to the internal satisfaction of caring for another being. This emotional engagement can make mascot games feel more rewarding over time, as the gratification stems from the player’s relationship with their pet rather than the completion of isolated tasks. In this way, mascot games stand out by blending emotional fulfillment with gameplay mechanics, offering a unique hybrid experience.

Conclusion

Mascot-based games with virtual pets differentiate themselves by fostering emotional bonds, enabling personalization, and offering psychological benefits that traditional games often lack. The cited research and community insights emphasize the importance of emotional engagement and responsibility in these games, which lead to increased empathy, reduced stress, and a greater sense of purpose. The integration of social features further enriches the gaming experience, creating communities that amplify the emotional connection between players and their pets. In contrast, games without virtual caregiving mechanics focus on external goals, which can limit their ability to resonate on a personal level. Ultimately, mascot gameplay is not just about entertainment—it’s about creating meaningful, enduring experiences that connect players to their virtual companions and to one another.

#02 Human Senses

How do different combinations of visual, auditory, and tactile cues influence users’ ability to detect and interpret complex pattern in data?

Human Senses and Beyond

When we talk about the human senses, the classic list of sight, sound, smell, touch, and taste usually comes to mind. However, there is growing evidence that humans perceive the world through far more than these five fundamental channels. In addition to balance, proprioception (awareness of body position), and temperature sensation, researchers continue to uncover other nuanced ways in which we sense and interpret our surroundings.
https://aeon.co/videos/aristotle-was-wrong-and-so-are-we-there-are-far-more-than-five-senses

For the scope of this research, I will concentrate on sight, sound, and touch—particularly regarding how data can be represented and experienced through these modalities.


Accessibility in Design

In modern design practice, accessibility is a fundamental principle rather than an afterthought. Whether creating websites, data visualizations, or interactive installations, designers should integrate accessibility guidelines from the start. These guidelines typically include:

  • Color Contrast and Shape Differentiation
    Ensuring legibility and clarity for individuals with various visual abilities, including color blindness.
  • Alternative Text and Descriptions
    Providing alt text for images and clear labeling for data charts to support screen readers.
  • Flexible Interaction Methods
    Offering keyboard or alternate navigation modes for users who cannot interact with a mouse or touch interfaces.

Adhering to these practices benefits not just users with disabilities; it often leads to improved usability and clarity for everyone.
https://accessibility.huit.harvard.edu/data-viz-charts-graphs

Listen, Feel, Hear the Data

Sonification: Transforming Data into Sound

Definition and Rationale
Sonification involves mapping numerical data or other abstract information to audible properties such as pitch, volume, rhythm, or timbre. Its fundamental goal is to leverage the human auditory system’s sensitivity to changes in frequency and amplitude. This can be particularly useful when data contains temporal patterns or fluctuations that might be more readily perceived through sound than sight.

  • Time-Based Patterns: For datasets that evolve rapidly, detecting a small uptick or sudden dip is sometimes easier when it’s rendered as a change in pitch or tempo.
  • Parallel Processing: The brain processes auditory and visual stimuli along different pathways, so combining both channels can help distribute cognitive load.
  • Inclusive Experiences: Individuals with visual impairments or color-vision deficiencies can gain richer insights by “listening” to data, reducing reliance on purely visual cues.
Design Considerations
  1. Data-to-Sound Mapping: Deciding which data variables map to pitch, volume, or rhythmic patterns is crucial. Overly complex mappings can overwhelm users, while oversimplified mappings might convey only superficial insights.
  2. Contextual Meaning: Providing brief textual or spoken labels can clarify what changes in pitch or tempo signify, helping users build intuitive mental models.
  3. Avoiding Auditory Overload: Continuous, intense auditory cues can be fatiguing. Subtle sound cues or situational “alerts” (playing a specific note only when a threshold is crossed) often strike a better balance.

https://www.loudnumbers.net
https://datasonifyer.de/en/
https://science.nasa.gov/mission/hubble/multimedia/sonifications/


Tactile Interfaces: Feeling the Data

Definition and Applications
Tactile interfaces, often called haptic interfaces, communicate information through the sense of touch—vibrations, pressure, temperature changes, or textural shifts. This approach is notably valuable for individuals with visual or auditory impairments, but it also holds potential for creating richer, more immersive data experiences for all users.

  • Vibrotactile Feedback: Short pulses or vibration patterns can indicate specific data thresholds or events, such as crossing a predefined limit or detecting an anomaly.
  • Physical or 3D Representations: Tactile data displays can take the form of raised surfaces, 3D-printed graphs, or shape-changing interfaces. Users can literally feel the peaks, troughs, or relationships in data.
  • Thermal or Pressure Feedback: Emerging technologies allow for subtle temperature changes or pneumatic feedback. For instance, temperature gradients might mirror climate data, enabling users to “feel” environmental shifts over time.
Design Considerations

Integration with Other Senses: Tactile interfaces often work best with visual or auditory cues. Each modality can reinforce or clarify the other, fostering a more complete understanding of the data.

Tactile Resolution: Human touch has limits in distinguishing small differences in vibration frequency or texture. Designers must tailor the granularity of feedback to what users can reliably perceive.

Attention and Comfort: Continuous or intense haptic signals can lead to sensory fatigue. Designers should consider using event-based or gentle transitions to avoid discomfort.


Connecting Sensory Design and Accessibility

The overarching theme linking these ideas is that designing for accessibility often creates a more inclusive, engaging experience for everyone. This approach demands thoughtful consideration of how data is conveyed: beyond color and labels, it involves weaving together sight, sound, and touch. Whether in assistive technologies, artistic installations, or everyday data dashboards, a multisensory perspective can expand what is possible in data communication.

Level Up Your Gains: Current Landscape of Gamified Strength Training Apps

The hype around fitness and the growth of a more health-conscious generation has not only led to a rise in fitness studio subscriptions but also fitness related apps supporting users in their fitness journey.
It is not surprising that some have went beyond simply tracking progress and started gamifying your workouts. However, while the market for gamified endurance sports apps is well developed, strength training remains an area with potential. This post investigates a range of current strength training and rep-tracking apps, analyzing their strengths, weaknesses, and gaps that a gamified mascot-based strength app could fill.

1. HeroFit

HeroFit gamifies strength training by letting users level up avatars and earn rewards through workout completion. Its leaderboard and progression features encourage friendly competition and consistent use.

Where it falls short:
The app only scratches the surface of gamification and lacks more engaging content/functions which could lead to getting disinterested quickly. It’s focus on external competition may also discourage users who are not driven by rankings or social comparison. Additionally, it lacks personalized, adaptive challenges based on the user’s progress.

2. Workout Quest

Workout Quest integrates RPG-style quests, where users earn experience points and “level up” by completing exercises. The adventure-based narrative adds a fun twist to strength training.

Where it falls short:
Its gamification is mostly surface-level, with limited integration into actual workout tracking. The app could offer more robust analytics and deeper customization for different fitness levels.

3. Nerd Fitness Journey

Nerd Fitness Journey uses gamification to help users progress through fitness “missions” in a game-like format. It combines nerd culture with fitness, providing users with creative challenges tied to fandoms like Star Wars or superheroes.

Where it falls short:
While its themes are engaging, the app lacks strong rep-tracking features and strength-specific guidance. Additionally, the gamified missions often feel loosely connected to actual strength progression, making it less effective for serious lifters.

4. Treeceps

Treeceps offers a mix of workout tracking and gamified elements, encouraging users to complete strength-training workouts to progress within the game.

Where it falls short:
The app struggles to differentiate itself from competitors. Its narrative and progression systems feel underdeveloped, and it lacks unique elements that would make it stand out.

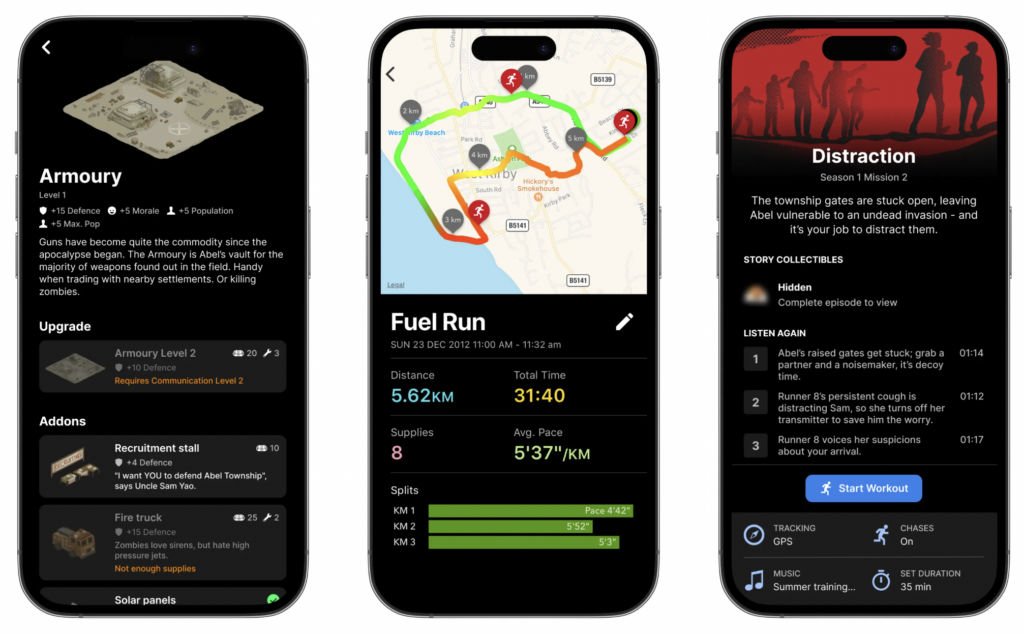
5. Zombies, Run! (Endurance Sport Example)

This app demonstrates how to create an immersive narrative experience, motivating users with a compelling storyline and rewards tied to activity.

Where it falls short (for strength training):
Zombies, Run! is heavily focused on cardio. While it succeeds in gamifying endurance training, it provides little insight for adapting similar concepts to strength workouts.

General Takeaways

Across the board, these apps face several challenges:

1. Shallow Gamification: Many apps fail to integrate gamification deeply into the workout process. Points, badges, and leaderboards are motivating but often lack a sense of long-term progression or narrative depth.

2. Lack of Personalization: Few apps offer truly adaptive systems that adjust based on user progress, fitness goals, or skill level.

3. Limited Emotional Engagement: Existing apps rarely create a personal connection with users, relying on extrinsic motivation rather than intrinsic factors like emotional investment.

The Opportunity: A Mascot Based Strength Tracking App

A Mascot-based app for strength training could fill a unique niche in this space by addressing the above gaps. Here’s how:

• Deep Emotional Engagement: Users could “raise” a virtual character (like a Tamagotchi) whose progress and well-being depend on their workouts. Skipping a session could lead to setbacks for the character, creating a sense of responsibility and emotional connection.

• Intrinsic Motivation: Instead of external competition, users would focus on caring for their character and watching it grow. This fosters a more personal and sustained sense of motivation.

• Adaptive Progression: The app could introduce challenges and “boss battles” tailored to the user’s fitness level. For example, attempting a personal record could unlock a new stage in the game.

• Story-Driven Narrative: Much like Zombies, Run!, the app could incorporate an engaging storyline that evolves as the user trains, adding depth and continuity to the gamified experience.

Conclusion

While the current offerings in gamified strength training have laid a solid foundation, they leave much to be desired in terms of depth, personalization, and emotional engagement. A Tamagotchi-inspired app could bridge these gaps, creating a new standard for gamified fitness that is both fun and meaningful. By combining interactive storytelling, adaptive challenges, and emotional investment, such an app has the potential to revolutionize how people approach strength training.

Introduction to the Research

Leveraging AR and IoT to Revolutionize Retail: A Comprehensive Introduction

1. Overview of the Project

Purpose of the Research

This research investigates how the integration of Augmented Reality (AR) and the Internet of Things (IoT) can fundamentally reshape the retail shopping experience. By overlaying digital content in physical store environments (using AR) and incorporating real-time, data-driven insights through IoT, the project aims to:

  1. Enhance Customer Engagement

• AR-based virtual product try-ons and in-store navigation.

• Immersive experiences that keep shoppers engaged and informed.

  1. Streamline Operations

• IoT-enabled personalized shopping recommendations and automated inventory management.

• Real-time inventory tracking and dynamic promotions or price adjustments.

  1. Foster a Seamless Physical-Digital Integration

• Intuitive user interfaces that merge AR and IoT data into one cohesive retail journey.

• Improved customer satisfaction and loyalty through technology-driven interactions.

Ultimately, the study will examine how intuitive interfaces and seamless integration can increase convenience, boost sales, and elevate the overall brand experience.

2. Understanding the Technologies

2.1 Internet of Things (IoT)

Definition

The Internet of Things (IoT) is a network of interconnected devices capable of collecting, transmitting, and acting upon data. Examples range from everyday consumer products (AC units, TVs, smart thermostats) to specialized sensors (smoke detectors, temperature and humidity monitors).

IoT Architecture Essentials

  1. Device Layer

• General Devices (e.g., ACs, TVs, Lights).

• Sensing Devices (e.g., smoke detectors, temperature, humidity, light sensors).

• These devices gather environmental data and communicate with each other through a gateway.

  1. Gateway or Aggregation Layer

• Manages data flow between devices and the Processing Layer.

• Employs protocols such as MQTT and HTTP to handle varied data formats.

• Acts as a message broker, bridging different networks and ensuring data consistency.

  1. Processing Engine or Event Processing Layer

• Processes the incoming data, performs analytics, and triggers appropriate actions.

• Stores information in databases for real-time dashboards and long-term analysis.

  1. Application Layer (API Management)

• Provides the interface (web portals, dashboards, mobile apps) for users to interact with the system.

• Handles external API calls and integrates with other services (e.g., cloud analytics platforms).

  1. Security and Identity Management

• Device managers and identity/access managers safeguard the entire ecosystem.

• Ensures data privacy, handles secure logins (OAuth2), and maintains policy control.

Why IoT Matters in Retail

• Real-Time Inventory & Promotions: Retailers can monitor stock levels, adjust prices, and promote items based on real-time data.

• Smart Shopping Assistance: Automated recommendations (e.g., nutritional info, expiration dates) can be pushed to customers’ devices.

• Operational Efficiency: Reducing manual inventory checks and automating repetitive tasks can lower costs and free staff to focus on customer service.

Challenges in IoT

• Interoperability: Multiple devices, sensors, and networks using different protocols.

• Power and Bandwidth Constraints: Many IoT devices operate in low-power environments with limited connectivity.

• Security & Privacy: Large volumes of data require robust security standards (e.g., ISO 30141) and compliance with data protection laws.

2.2 Augmented Reality (AR)

Definition

Augmented Reality (AR) integrates digital elements into a real-world environment, enhancing user perception via overlays on a physical space.

Types of AR

  1. Marker-Based AR

• Relies on predefined triggers (QR codes, images, or specific objects) to launch an AR experience.

• Commonly used for virtual try-ons, visualizing furniture in-home, or interactive product packaging.

  1. Markerless AR

• Utilizes GPS, sensor data, or computer vision to map surroundings in real-time, enabling more dynamic and spontaneous overlays.

• Often used for in-store navigation or advanced outdoor experiences; typically requires more complex hardware and higher computational power.

  1. Projection-Based AR

• Projects digital images directly onto physical surfaces. For retail, this could be used in interactive displays that overlay information onto products in-store.

Why AR Matters in Retail

• Immersive Customer Experiences: Virtual try-ons for clothing or makeup, making it easier for customers to visualize products.

• In-Store Navigation: AR can guide customers to specific products, highlight promotions, or provide additional product details.

• Customer Confidence: By seeing how products look or work in real-time, shoppers are more likely to make informed purchasing decisions.

Retail-Specific AR Use Cases

Virtual Try-Ons (Fashion, Cosmetics)

One of the most common AR applications in retail is the virtual try-on feature. By using a smartphone camera or a smart mirror in-store, customers can see how clothes or makeup products look on them before making a purchase. This reduces the need for physical trials and can help customers explore different styles more quickly.

Interactive Product Demos (Furniture, Electronics)

Imagine seeing how a new coffee table or TV would fit in your living room without having to measure or rearrange furniture. AR applications allow shoppers to “place” digital models of products into their homes. This not only boosts customer confidence in the purchase decision but also cuts down on returns and exchanges.

Software Tools

• Unity: A popular game engine that supports AR development through various plugins.

• Vuforia: One of the first AR development platforms; integrates well with Unity for marker-based AR experiences.

• ARKit (iOS) and ARCore (Android): Native AR development kits from Apple and Google, respectively. These frameworks offer markerless tracking, surface detection, and more advanced features to create realistic AR scenes.

Hardware Considerations

• Smartphones: Currently the most ubiquitous AR hardware. Almost everyone has a smartphone with a camera, making AR experiences accessible to a large audience.

• AR Glasses: Headsets like Microsoft HoloLens and Magic Leap provide more immersive AR experiences but remain niche due to cost and technical limitations. As these devices become cheaper and more user-friendly, expect broader adoption in retail settings—think hands-free product info while browsing store aisles.

3. Research Goals

  1. Personalized Shopping Experience

• Combine real-time IoT data with AR overlays to deliver tailored recommendations.

• Present nutritional information, expiration dates, or usage tips directly in the user’s field of view.

  1. Smart Shopping Assistance

• Provide interactive support (e.g., store maps, automated product suggestions) via AR-enabled apps or devices.

  1. Real-Time Inventory and Promotions

• Automate stock level tracking and display in-store promotions directly through AR.

• Empower retailers to push timely offers based on customer proximity or item popularity.

  1. Automated Checkout

• Minimize queues and human interaction by using IoT sensors and AR scanning capabilities.

• Enhance the checkout experience with seamless scanning of items and instant payment.

4. Methodological Framework

4.1 Data Collection

• Quantitative Methods

• Surveys: Gauge customer satisfaction, user adoption rates, and staff usability feedback.

• Metrics: Track sales figures, AR engagement (e.g., session length, feature usage), and inventory accuracy before and after implementation.

• Qualitative Methods

• Interviews & Focus Groups: Collect in-depth feedback from both customers and retail staff on the usability and perceived value of AR/IoT features.

• Observational Studies: Observe shopper behavior in-store to identify friction points and measure how AR/IoT interventions affect the shopping flow.

4.2 Data Analysis

• Quantitative Analysis

• Descriptive Statistics: Summarize average sales uplift, user engagement, and inventory discrepancies.

• Inferential Statistics: Conduct regression or correlation analyses to link technology usage with sales performance or customer satisfaction levels.

• Qualitative Analysis

• Thematic Coding: Identify recurring themes in interviews (e.g., ease of use, perceived convenience, privacy concerns).

• Member Checking: Share initial interpretations with participants to ensure accuracy and credibility.

4.3 Validity and Reliability

• Triangulation: Combine multiple data sources (e.g., surveys, interviews, observation) to confirm findings.

• Pilot Testing: Conduct small-scale trials of AR/IoT prototypes to refine the user interface and data collection methods.

• Member Checking: Involve users and participants in reviewing preliminary results to validate interpretations.

4.4 Ethical Considerations

• Informed Consent: Clearly explain the study’s purpose, benefits, and any potential risks to participants.

• Confidentiality: Protect personal data through anonymization and secure storage.

• Regulatory Compliance: Adhere to data protection standards (GDPR, CCPA, etc.) when dealing with user data.

4.5 Limitations

• Adoption Variability: Some stores may be more technologically prepared than others, affecting consistency.

• Response Bias: Survey and interview responses might not always reflect true behaviors.

• Resource Constraints: The scope of the study may be limited by budget, time, and available technical infrastructure.

5. Expected Outcomes

  1. Enhanced Customer Engagement

• AR visualization makes shopping more interactive, driving increased product interaction and brand affinity.

• IoT-driven personalized offers encourage deeper connections between shoppers and retailers.

  1. Improved Operational Efficiency

• Real-time inventory management through IoT reduces stock discrepancies and optimizes restocking processes.

• Automating routine tasks enables employees to focus on higher-value interactions with customers.

  1. Increased Sales and Revenue

• AR’s ability to illustrate product features fosters higher conversion rates.

• Personalized journeys (e.g., recommendations, targeted promotions) strengthen customer loyalty and repeat purchases.

  1. Seamless Physical-Digital Integration

• Blending AR and IoT creates a unified shopping environment that minimizes friction between online and offline channels.

• User-friendly interfaces ensure smooth navigation and maintain consistent brand experiences.

  1. Scalability and Adoption Potential

• Identifying best practices for integrating AR and IoT can expedite rollout across diverse retail formats (grocery, fashion, electronics, etc.).

• The insights gained may influence broader digital transformation initiatives in the retail sector.

6. Key Challenges and Opportunities

6.1 Challenges

  1. High Implementation Costs

• AR headsets or advanced sensors can be expensive, creating barriers for smaller retailers.

• Ongoing software updates, training, and maintenance add to the total cost of ownership.

  1. Data Privacy and Security

• Personal data is central to delivering tailored experiences, making robust encryption and compliance essential.

• Potential data breaches could erode customer trust and trigger legal ramifications.

  1. Technical Integration Issues

• Merging AR and IoT systems with existing infrastructures is complex (network protocols, legacy systems).

• Requires specialized IT expertise and thorough testing to ensure reliability.

  1. Customer Adaptation

• Not all customers are familiar or comfortable with AR/IoT features; education and onboarding are crucial.

• Risk of alienating less tech-savvy shoppers if the interface is not intuitive.

  1. Dependence on Internet Connectivity

• Stable, high-speed connections are essential for real-time data exchange.

• Some retail locations may have inadequate infrastructure, leading to potential downtime or degraded experience.

6.2 Opportunities

  1. Enhanced Customer Experience

• AR delivers immersive product interactions, while IoT personalizes offers—together, they significantly boost satisfaction and loyalty.

  1. Operational Efficiency

• IoT can automate and optimize many back-end processes (inventory counts, ordering), reducing errors and labor costs.

  1. Increased Sales and Retention

• Visual demonstrations, try-ons, and personalized suggestions boost purchase confidence and encourage repeat visits.

  1. Competitive Advantage

• Early adopters gain an edge, positioning themselves as innovative, tech-forward brands.

  1. Data-Driven Insights

• Detailed analytics on shopper behavior enable informed decision-making and tailored marketing strategies.

  1. Scalability Across Sectors

• AR/IoT solutions are highly adaptable, spanning groceries, fashion, cosmetics, consumer electronics, and more.

7. Concluding Remarks

This research sets the stage for how AR and IoT might seamlessly merge to create a reimagined, future-ready retail environment. By addressing key challenges—such as cost, security, and user acceptance—retailers can unlock unprecedented levels of personalization, operational efficiency, and customer satisfaction.

The combination of robust methodology, ethical data handling, and iterative prototyping will ensure that findings are both credible and practically valuable. In the long run, scalable best practices that emerge from this work can shape industry standards, helping more retailers adopt AR/IoT ecosystems and stay competitive in a rapidly evolving market.

03 Informal survey

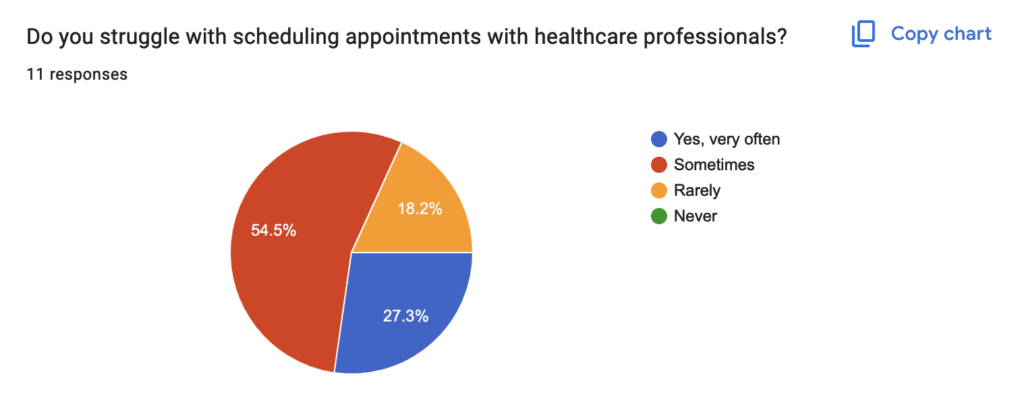
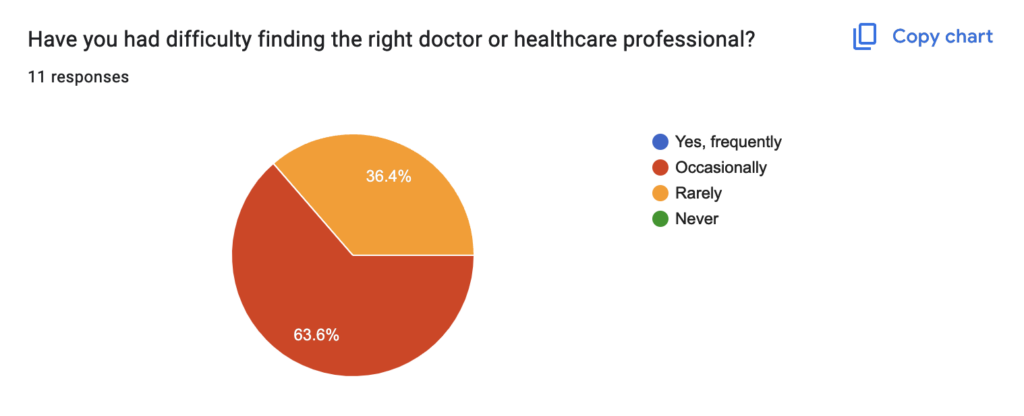
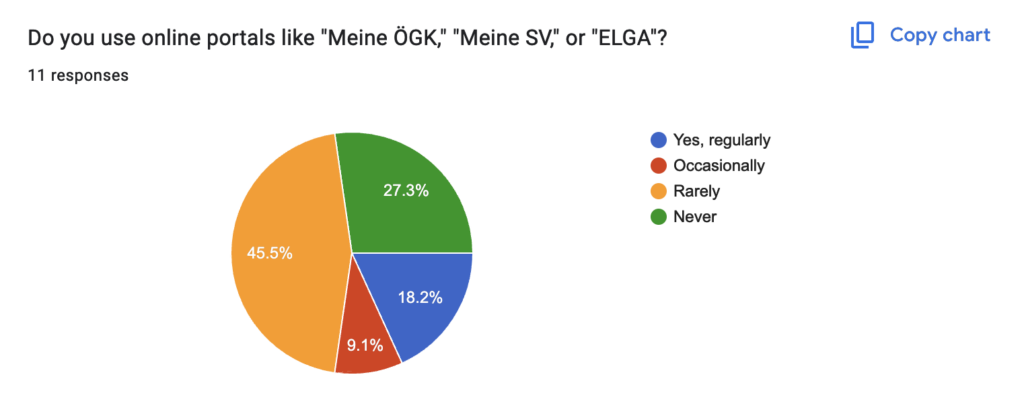
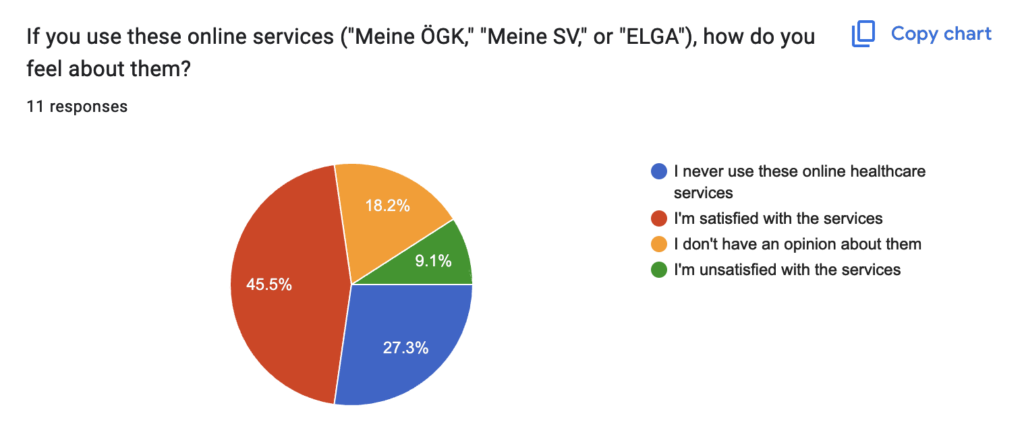
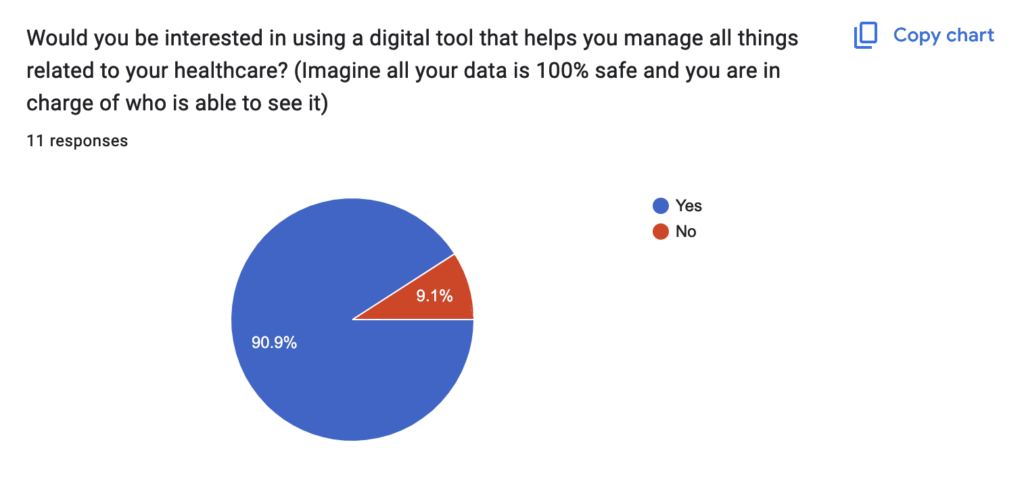
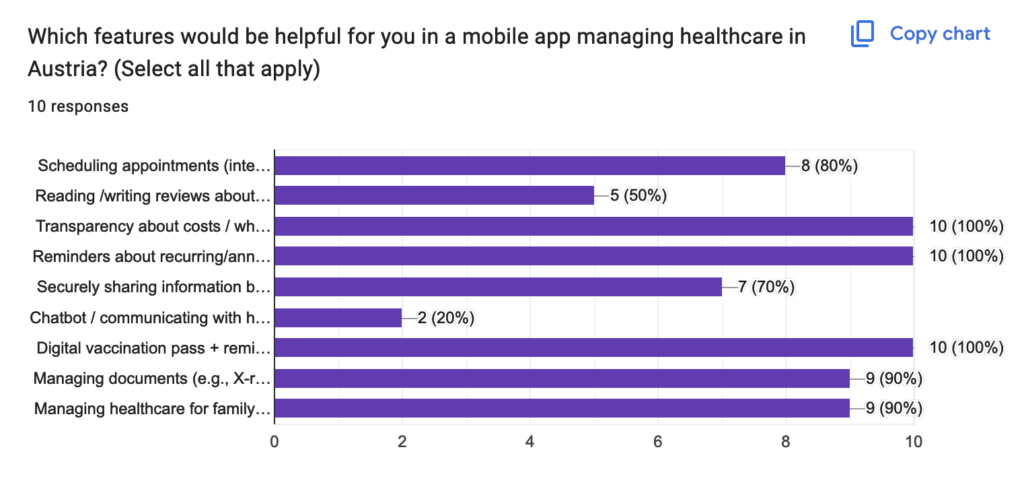
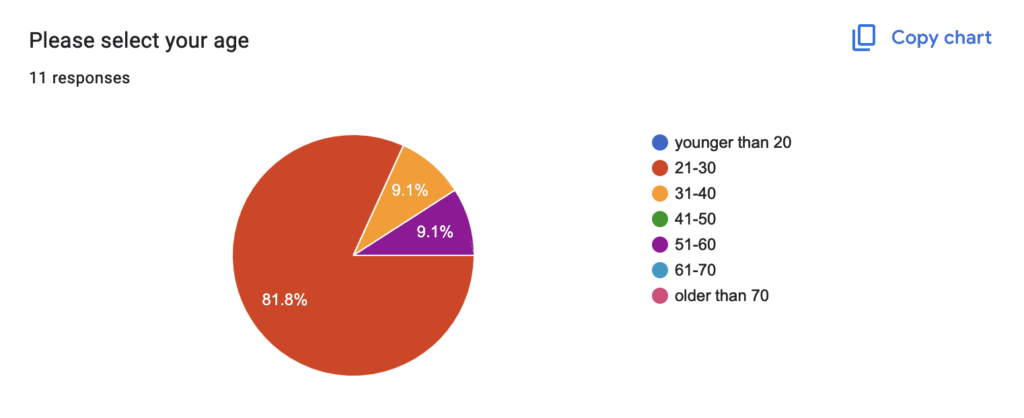
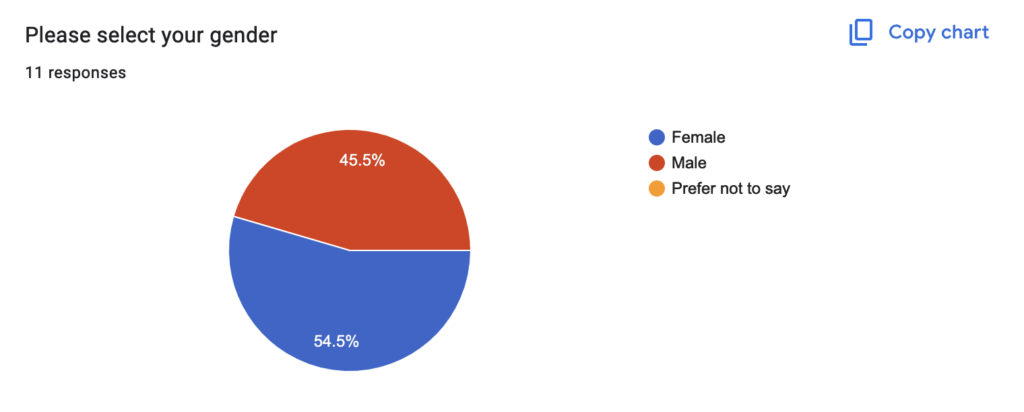
Before the Christmas break I created a quick survey to determine whether the people in my bubble share similar frustrations with current digital healthcare solutions. It’s not a highly scientific study; rather, I’m gathering ideas and seeking confirmation that there’s room for improvement in the digital health sector.

I received 11 responses and learned that many people may not engage with questionnaires, even short ones. Maybe it was also due to the holidays and people were busy eating cookies. For my official survey, I’ll need to reach out to a larger audience or focus on obtaining quality data rather than just quantitative results. If you’re reading this and would like to contribute, you can participate in the questionnaire by following this link. It only takes 5 minutes 😉 https://forms.gle/rSiXXLivi6TypXwUA

Results

Below you will find screenshots of the results.

In conclusion, this informal questionnaire has served as a valuable test run, providing insights into what I need to consider for the official round as I move closer to completing my thesis.

#03 Are we living in an epidemic of loneliness?

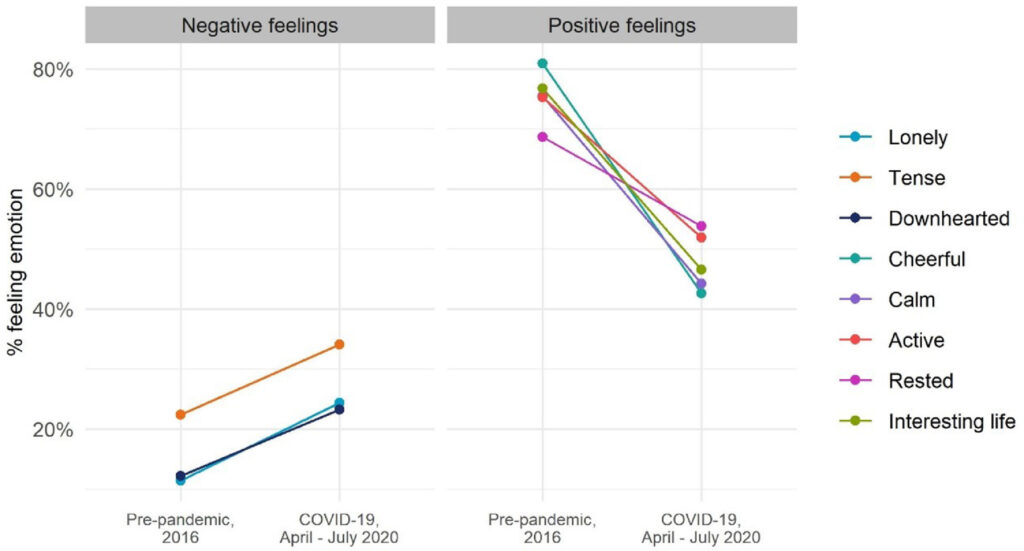
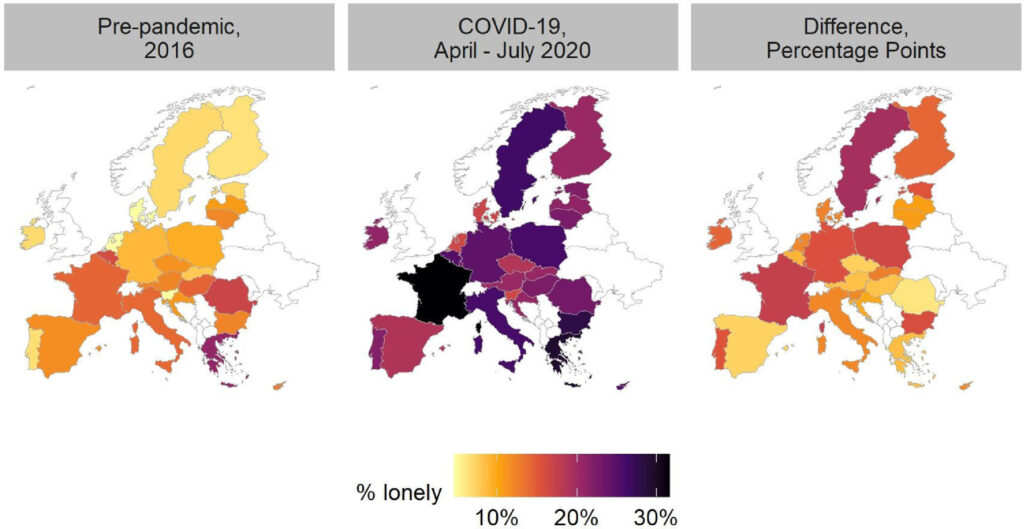
The heightened risk of loneliness during the COVID-19 pandemic has brought increased attention to the issue, leading to loneliness and social isolation being recognized as serious public health concerns.1 A study conducted by the IFO Institute and the European Commission reveals that in 2016, 12 % of people in the European Union frequently experienced the feeling of loneliness. During the initial months of lockdown, this figure increased to 25%. 2

Source: Loneliness in Europe before and during the COVID-19 pandemic 2

Some researchers even claim that we are living in an epidemic of loneliness right now. However, loneliness is not a modern-day phenomenon. A study by the American Psychological Association analyzed 345 studies comprising 437 independent samples, with a total of 124,855 young adults completing the UCLA Loneliness Scale between 1976 and 2019. Over these 43 years, the study revealed a gradual increase in loneliness. Even though there was constant increase in loneliness, talking about an epidemic of loneliness might be exaggerated. 3

Source: Is Loneliness in Emerging Adults Increasing Over Time? A Preregistered Cross-Temporal Meta-Analysis and Systematic Review 3

Who is at highest risk for loneliness?

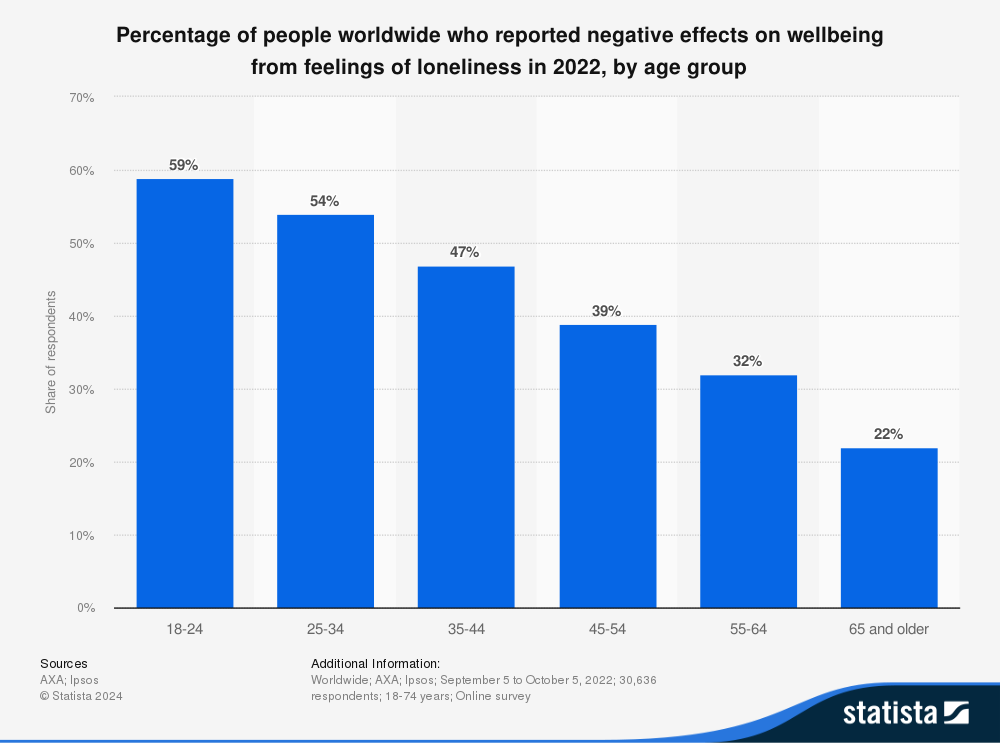
Age is a frequently studied aspect in connection with loneliness. For a long time, the focus was on older people, as they have a particularly high risk of being affected by loneliness. However more recent studied showed that there is a u-shaped relationship between age and loneliness, because also young people are highly affected by loneliness these days. 4

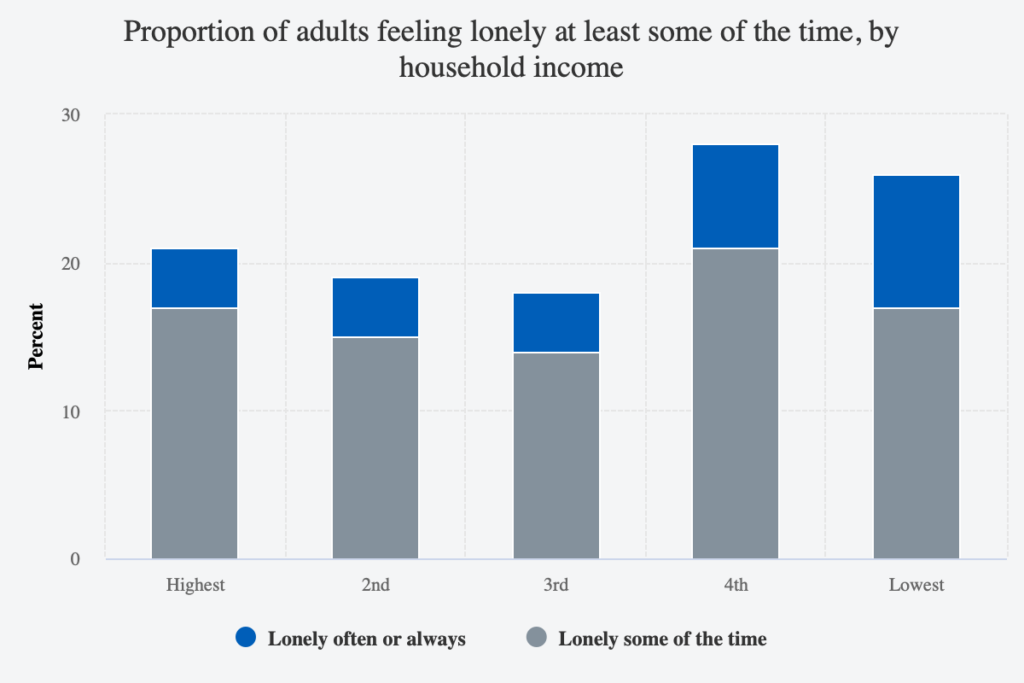
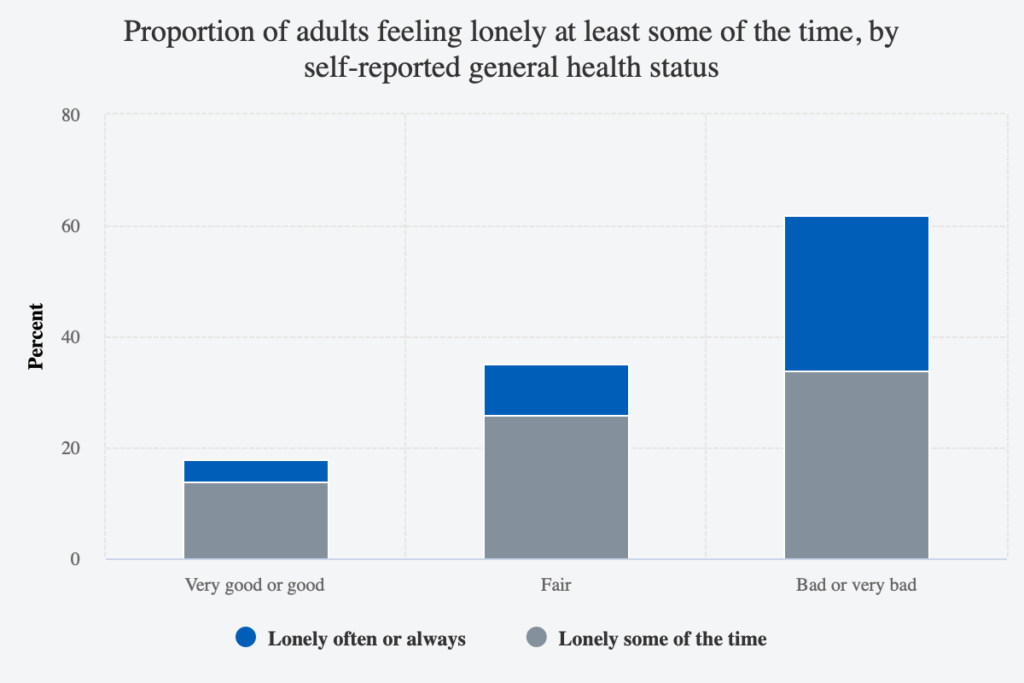
Examining socio-economic factors such as income, health, and living conditions, several studies indicate that individuals with lower income levels are more likely to experience loneliness. Similarly, those who report poor health tend to feel lonelier compared to individuals with good health. Furthermore, research shows that individuals living alone are more likely to experience loneliness. 2 5  

Source: Health Survey for England 2021: Loneliness and Wellbeing 5

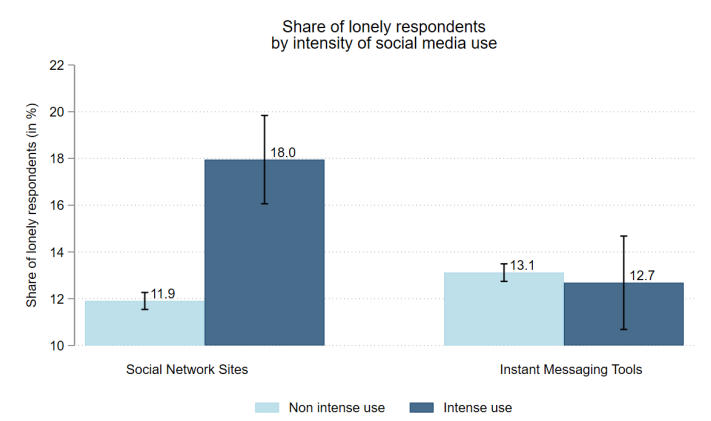
Additionally, technology, particularly social media, has a significant impact on our relationships and social interactions. Even though we are more connected than ever, people tend to feel more lonely nowadays. Excessive social media use (in the study from the European commission excessive means two or more hours per day on social media) can contribute to feelings of loneliness, a fear of missing out, and a lack of meaningful social connection. 6 7

Source: EU Loneliness Survey, 2022 6

Since several studies show the negative impact of loneliness on health and its growing significance in public health, several governments and institutions — such as the government of United Kingdom and Japan, the Ministry of Health in the Netherlands, and the European Commission — are developing strategies to combat loneliness. 2 

The next blog post explains which impact loneliness has on our health.


Sources

[1] JRC, „Loneliness and social connectedness: insights from a new EU-wide survey“, 2023.

[2] J. Baarck, B. D’Hombres und G. Tintori, „Loneliness in Europe before and during the COVID-19 pandemic“, Health Policy, Bd. 126, Nr. 11, S. 1124–1129, Sep. 2022, doi: 10.1016/j.healthpol.2022.09.002.

[3] S. Buecker u. a., „Is Loneliness in Emerging Adults Increasing Over Time? A Preregistered Cross-Temporal Meta-Analysis and Systematic Review“, journal-article, 2021. doi: 10.1037/bul0000332.

[4] S. V. Schnepf, B. D’Hombres und C. Mauri, Hrsg., Loneliness in Europe. 2024. doi: 10.1007/978-3-031-66582-0.

[5] NHS Digital, Health Survey for England 2021: Loneliness and Wellbeing. Available: https://digital.nhs.uk/data-and-information/publications/statistical/health-survey-for-england/2021-part-2/loneliness-and-wellbeing. Accessed: Jan. 7, 2025.

[6] B. Dhombres, M. Kovacic, S. V. Schnepf, and Z. Blaskó, Loneliness and social media use in the European Union, European Commission, 2024, JRC135806.

[7] V. H. Murthy, „Our Epidemic of Loneliness and Isolation: The U.S. Surgeon General’s Advisory on the Healing Effects of Social Connection and Community“, 2023. [Online]. Verfügbar unter: https://www.hhs.gov/sites/default/files/surgeon-general-social-connection-advisory.pdf

Exploring already existing Climbing Boards in Bouldering: MoonBoard, Tension Board, Kilter Board, and More

Climbing boards have revolutionized the way climbers train, offering a dynamic and systematic way to build strength, technique, and endurance. Popularized by their versatility and community-driven route setting, boards like the MoonBoard, Tension Board, and Kilter Board have become staples in bouldering gyms worldwide. In this blog post, we’ll explore the key types of climbing boards, their pros and cons, and their costs to help gym owners and climbers alike make informed decisions.


1. MoonBoard

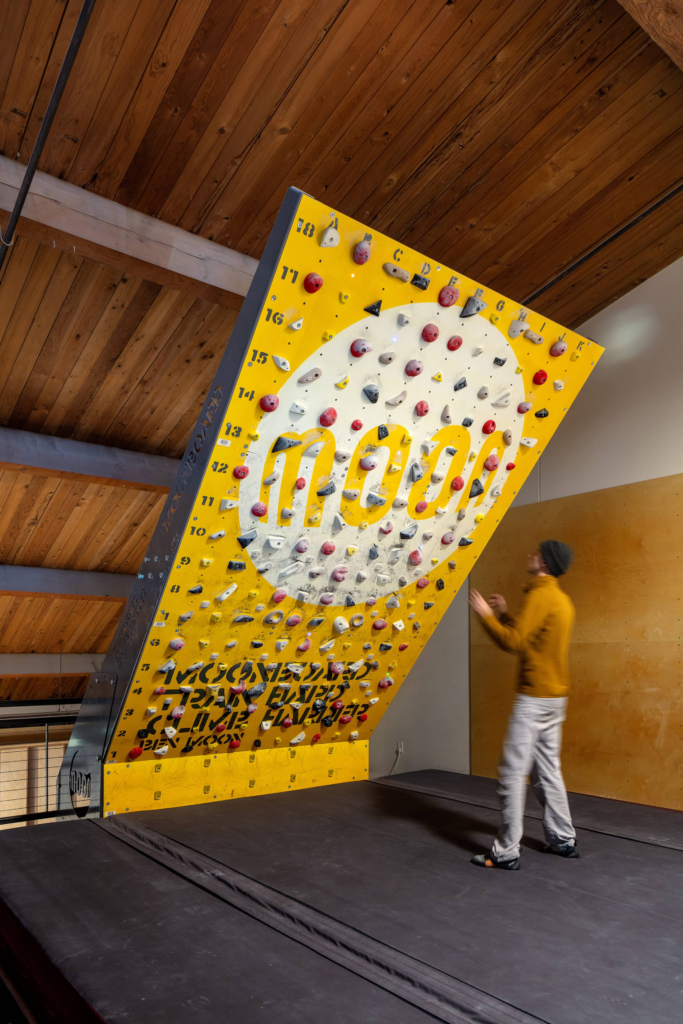
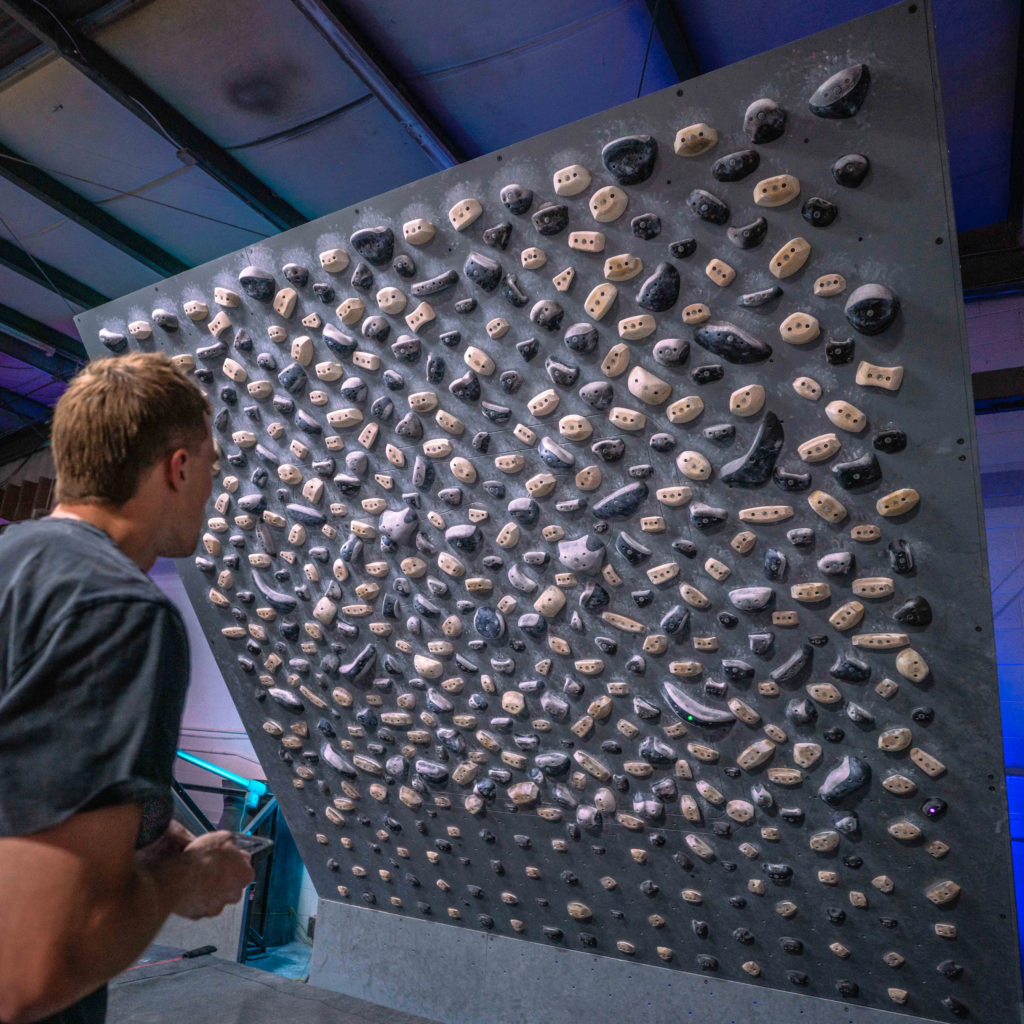
The MoonBoard is one of the most iconic training boards in the climbing world. It consists of a standardized 40-degree overhang wall, equipped with LED lights and holds arranged in a universal layout.

Pros:

  • Huge database of user-generated problems accessible via a mobile app.
  • Compact and space-efficient design.
  • Excellent for building power and finger strength.

Cons:

  • Extremely challenging for beginners due to the steep angle and sharp holds.
  • Limited hold variety compared to other boards.

Average Cost for Gyms:

  • Installation costs range from $5,000 to $10,000, depending on the wall size and LED integration.

2. Tension Board

Designed with wooden holds, the Tension Board offers a skin-friendly training experience and precise, uniform holds.

Pros:

  • Skin-friendly holds, ideal for long training sessions.
  • Provides a wide range of hold types and angles.
  • Compatible with adjustable wall angles.

Cons:

  • Wooden holds can feel slippery, especially for those used to resin holds.
  • Smaller problem database compared to the MoonBoard.

Average Cost for Gyms:

  • Prices typically range from $6,000 to $12,000, depending on the setup and adjustable wall features.

3. Kilter Board

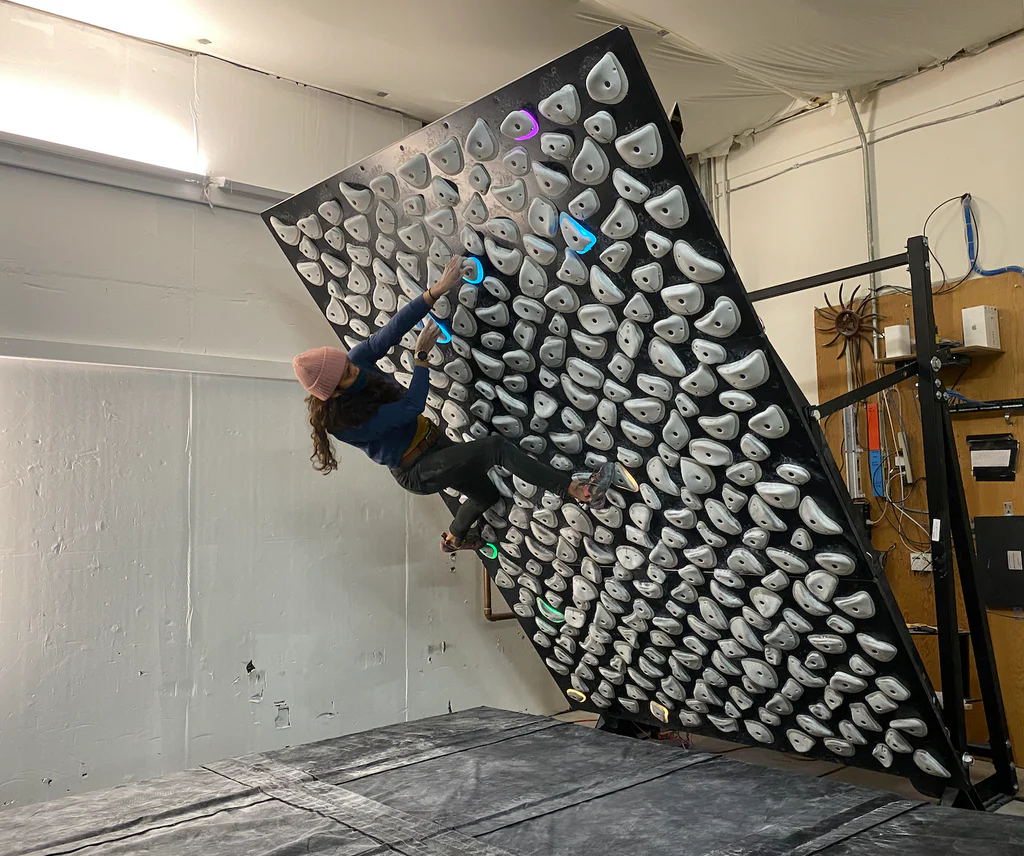
The Kilter Board is known for its customizable lighting system and extensive hold variety, catering to climbers of all levels.

Pros:

  • Adjustable angles, accommodating climbers from beginners to experts.
  • Wide variety of holds, including jugs, crimps, and slopers.
  • Bright LED system enhances usability in low-light settings.

Cons:

  • High initial cost compared to other boards.
  • Requires significant space for installation.

Average Cost for Gyms:

  • Expect to pay $10,000 to $20,000, depending on the size and features.


4. Homegrown or DIY Boards

For gyms with tighter budgets, a DIY climbing board offers flexibility and significant cost savings. These boards can be customized to match specific needs.

Pros:

  • Fully customizable hold layouts and wall angles.
  • Inexpensive compared to commercial systems.

Cons:

  • Lack of LED integration and standardized routes.
  • Time-consuming to build and maintain.

Average Cost for Gyms:

  • Costs can vary widely but often fall between $1,000 and $3,000.

How Smaller Gyms Can Benefit from Affordable Boards

Gyms with limited budgets can leverage DIY solutions or simpler systems like the Grassroots Board to provide valuable training options without breaking the bank. Investing in a functional but cost-effective setup allows gyms to cater to intermediate and advanced climbers while saving on upfront costs. Additionally, these gyms can engage their communities by hosting route-setting events or creating unique challenges tailored to their audience.

By prioritizing creativity and community involvement, gyms can provide excellent training opportunities without relying on high-end systems, ensuring climbers of all levels continue to thrive.


Conclusion

Climbing boards are an invaluable tool for bouldering gyms, enhancing training and fostering a sense of community. While premium boards like the Kilter Board and MoonBoard offer cutting-edge features, more affordable options like the Grassroots Board or DIY setups ensure accessibility for gyms of all sizes. By carefully considering their needs and budget, gyms can select the right board to meet their goals, inspiring climbers and maximizing their investment.