Behind The Scenes. Installing all sensors and cables into a tiny room.

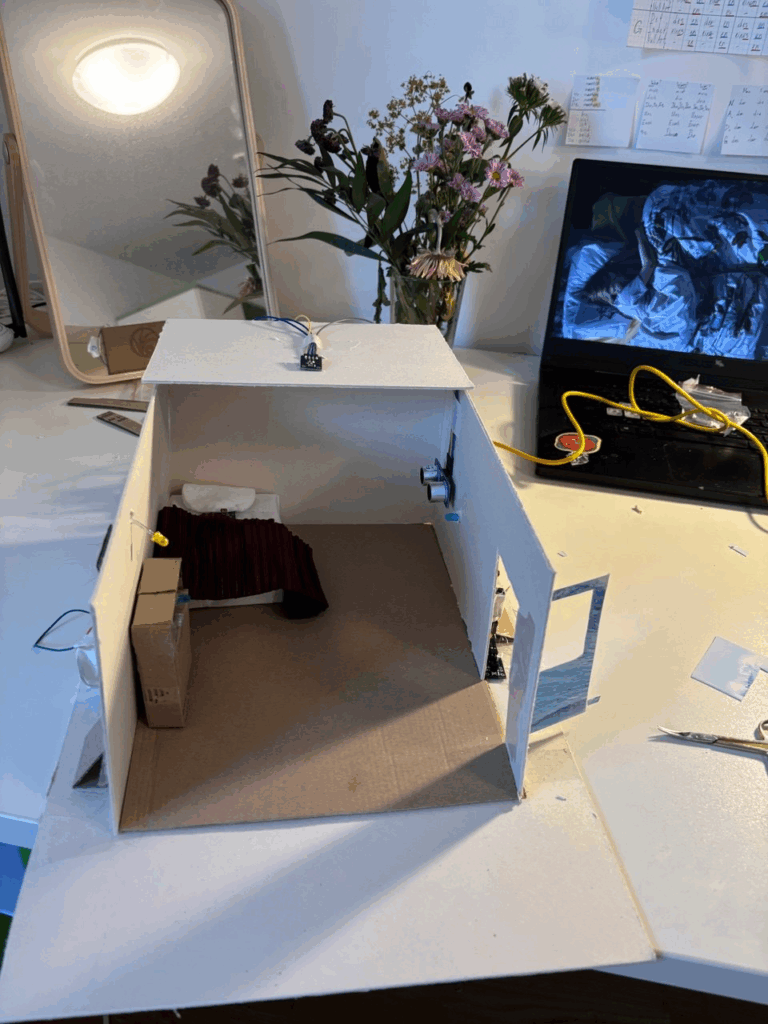
After testing everything on the table, it was finally time to bring the sensors into the tiny house I built. That’s when the real chaos and magic began.

Phase 1: The First Arduino Set – Doorbell & Laptop

I started simple. The first set of interactions included:

  • A doorbell: a button paired with a buzzer.
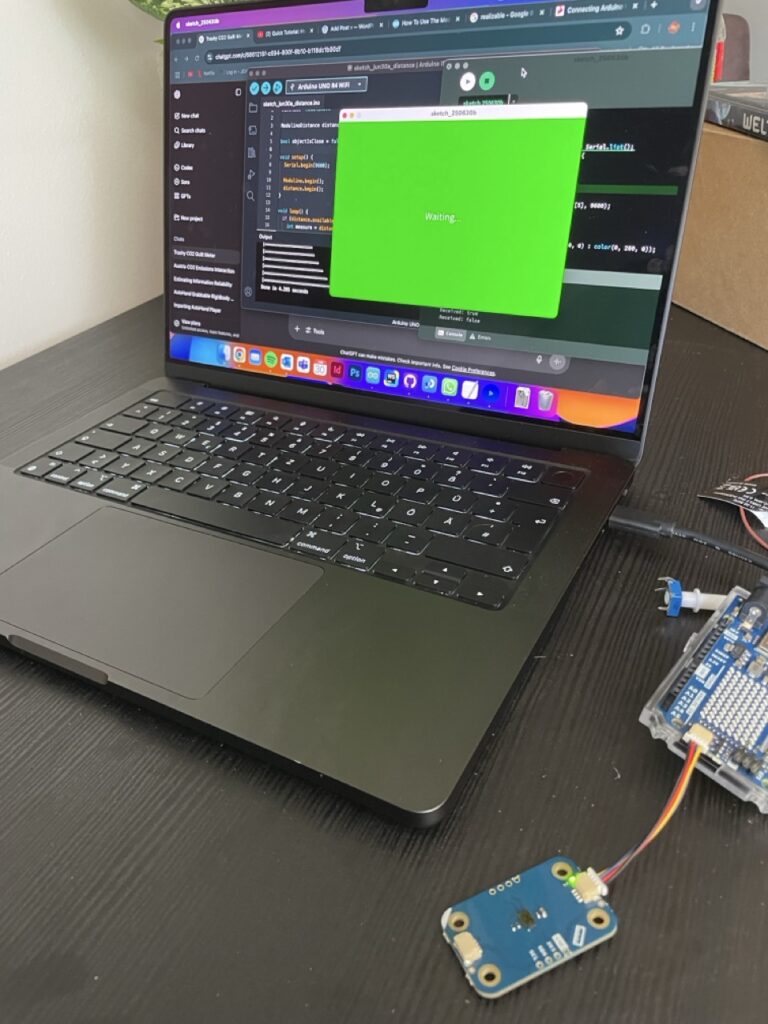
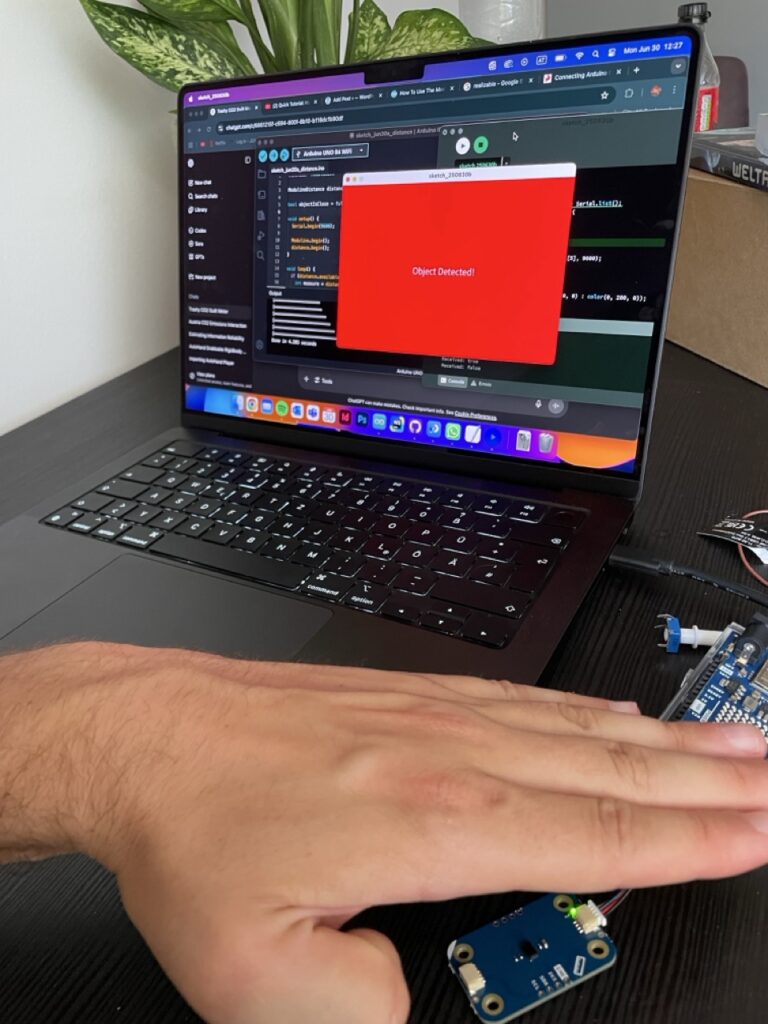
  • A laptop: triggered by a distance sensor, lighting up a small LED and playing a “startup” sound.

To make this work, I did small holes in the house walls to fit the lights and sensors. It wasn’t too hard, mostly about being careful with the details, especially when I had to connect two things to one leg of the button. It was tricky to get stable, and of course, when everything was finally ready, the buzzer went rogue and started buzzing constantly. Turned out it was just a bad connection. I had to redo the whole thing.

Phase 2: The Second Arduino Set – The House Comes Alive

This part was more complex. It took way longer not just because of the number of sensors, but also because I had to design furniture to hide them all before placing them in the house.

This set included:

  • A door interaction using a beam sensor to control the main light.
  • A bed interaction with a photoresistor that also controlled the main light.
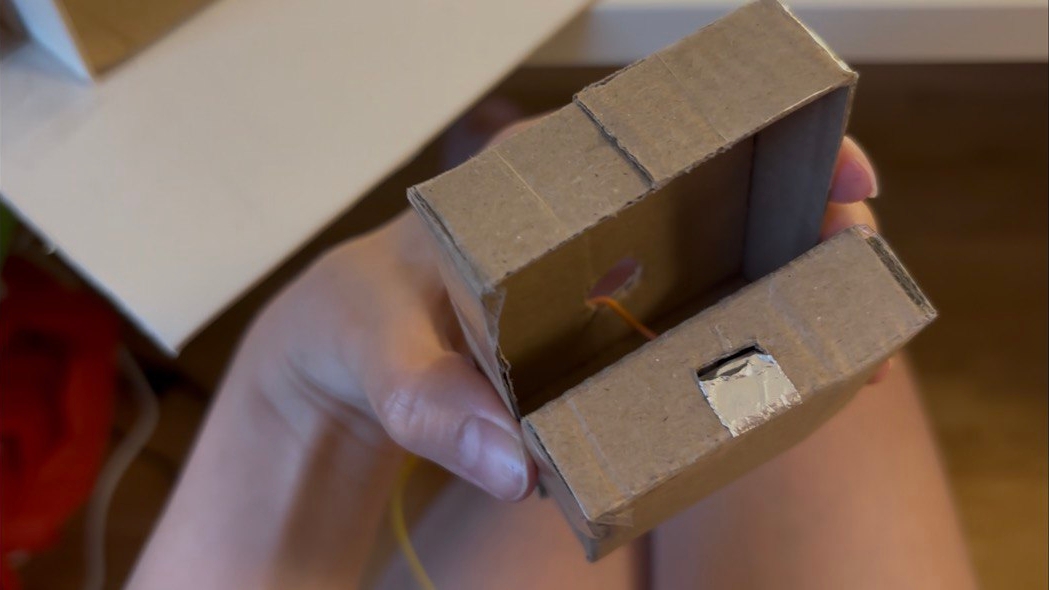
  • A drawer interaction using conductive tape to detect when the drawer was open.

The drawer was the hardest part. I didn’t know where to hide the cables. Eventually, I hid them inside the drawers and made small holes in the back wall to run them to the Arduino. Sounds neat? It wasn’t.

When I finished wiring everything and plugged it in… nothing worked 🙁

2AM Debugging and the Classic Mistakes

It was already 2am and I was too excited to sleep without seeing it all come to life. But the drawer interaction wasn’t working, the tape inside had ripped from all the handling, so no signal could pass through. I had to redo everything.

slay…

And worse, I had skipped one very important step: checking each sensor one by one. The door sensor was acting weird, jumping erratically between 0 and 1, or not reacting at all. As a beginner, I didn’t immediately see the problem. I tried everything… until I moved the power and ground connections on the breadboard closer to the source. That fixed it. At 4am. And yes, it felt like a small miracle.

P.S. I don’t even have any pictures or videos from trying to fix the door sensor because I was full head inside the problem and could not remember to do videos of how annoying the process was.

What I Learned

  • Always test sensors one by one before sealing them into furniture.
  • Connections that look “fine” might not actually work, check and recheck.
  • Even a tiny sensor setup can break down unexpectedly in a small-scale project.
  • Pain at 4am feels worth it when the room finally lights up.

By the next day, everything was running. And with the system installed, I could finally move on to the fun part, decorating the room. I didn’t expect so much to break during setup, but it taught me more than any tutorial.

#4 Alright… Now What?

So far, I’ve soldered things together (mentally, not literally), tested sensors, debugged serial communication, and got Arduino and Processing talking to each other. That in itself feels like a win. But now comes the real work: What do I actually do with this setup?

At this stage, I started combining the two main inputs—the proximity sensor and the potentiometer into a single, working system. The potentiometer became a kind of manual timeline scrubber, letting me move through 13 steps that represent a line, which should be a test for a potential timeline? The proximity sensor added a sense of presence, acting like a trigger that wakes the system up when someone approaches. Together, they formed a simple but functional prototype of a prototype, a rough sketch of the interaction I’m aiming for. It helped me think through how the data might be explored, not just visually, but physically, with gestures and motion. This phase was more about testing interaction metaphors than polishing visuals—trying to understand how something as abstract as historical emissions can be felt through everyday components like a knob and a distance sensor. This task pointed out to me, how important testing and the ideation of your ideas can be, to get a better understanding of your own thoughts and to form a more precise imagination of your plan.

Small Prototype to connect sensors in one file

Things about to get serious

Building on the knowledge I gained during the ideation phase, I connected my working sensor system, a potentiometer and proximity sensor to the Processing sketch I had developed during design week. That earlier version already included interaction through Makey Makey and homemade aluminum foil buttons, which made for a playful and tactile experience. In my opinion, the transfer to Arduino technology made the whole setup easier to handle and much cleaner—fewer cables, more direct control, and better integration with the Processing environment. The potentiometer now controls the timeline of Austria’s CO2 emissions, while the proximity sensor acts as a simple trigger to activate the visualization. This transition from foil to microcontroller reflects how the project evolved from rough experimentation into a more stable, cohesive prototype.

#3 Serial Communication Between Arduino and Processing

By this point, I had some sensors hooked up and was starting to imagine how my prototype might interact with Processing. But getting data from the physical world into my visuals? That’s where serial communication came in! On the Arduino side, I used “Serial.begin(9600)” to start the connection, and “Serial.println()” to send sensor values. In my case, it was messages like “true” when a hand moved close to the distance sensor, and “false” when it moved away. On the Processing side, I used the Serial library to open the port and listen for data. Every time a new message came in, I could check if it was “true” or “false”, and change what was being shown on screen — red background, green background, whatever. So I was prototyping the prototype, you could say.

Why this is so fascinating and helpful 🤯

I wanted to build something quick, easy to use and reactive—and serial communication made it possible to prototype fast without diving into WiFi, Bluetooth, or custom protocols. It lets me test ideas in minutes: turn a knob, wave a hand, watch the screen respond. And for something as conceptual and messy as visualizing CO2 history with simple and fast coding, that immediacy is everything.

Imagine you’re at an interactive museum exhibit about climate change. As a visitor approaches a screen, a hidden distance sensor detects their presence. The Arduino sends “true” to Processing, which triggers a cinematic fade-in of historical CO2 data and a narration starts playing. When the visitor steps away, the system fades back into a passive state, waiting for the next interaction. That whole experience? Driven by serial communication. One cable. A few lines of code. Huge impact.

Some helpful links for those who are interested in serial communication:

https://learn.sparkfun.com/tutorials/connecting-arduino-to-processing/all

2.6 Final Video: Prototyping Calm with the Breathing Circle

In this final blog post, I’m presenting a short video that showcases the development and insight behind my analog prototype, the Breathing Circle. Designed as a screen-free, tactile tool for guided breathing, this project explores how physical interaction can support emotional regulation in everyday life. From early sketches to laser-cut textures and user testing, the process revealed how simplicity, materiality, and intuitive design can foster moments of calm. The video summarizes my journey, shares user reactions, and reflects on what future iterations could look like.

15. Building the First Decay Prototype

Sculpting the Core

In Blender. I modeled a central, organic symbol, a 3d flower.
I moved the flower model into KeyShot, for its Texture, Light, and Animation where I focused on giving it a simple machine like vibe, animated the flower slowly turning, anexported the frames only, which gave me full control later in video editing.
Once rendered, the frames were stitched together in Premiere Pro to produce a looping animation, lightweight, editable.

Resolume + FaceOSC + Max/MSP

Since the flower has to respond to people, I used FaceOSC to track facial movements, interpreting gestures and expressions. A Max 9 patch to process this incoming data and map it to decay parameters. UDPsend to push the control signals directly to Resolume Arena, where the flower video lives. Resolume became the decay environment. As a viewer approaches or moves, the flower visuals begin to glitch, shake and distort.

What’s Next

Now that the pipeline works, from face input to visual output the next steps would be working on:

-More advanced facial tracking
-Sound integration: the next phase will let the flower sound different based on mood
-Visual regeneration zones: can stillness heal the decay?

Final Thoughts

Prototypes are weird. You spend a lot of time worrying about how close they should be to the final piece, how polished, how functional, how perfect. But in the end, what really mattered to me was the process.Just figuring out how to get even a little closer to the feeling, the behavior I imagined was enough.

#2 First Steps with Arduino

So my initial project about the CO2 emissions in AUT had 13 steps on a timeline you could loop through with key controls. So I’m thinking how am I gonna set my Arduino parts up, to work with my existing concept? This blogpost should tell you about my first steps, trying to figure that out. Connecting the parts—trying to get progress towards the concept of my existing one.

My thoughts creating this code were pretty loose at first. I just wanted to get some kind of input from the potentiometer, without fully knowing what I’d do with it yet. I had the concept of a CO2 visualization in the back of my mind, and I knew I had split the data into 13 time periods earlier, so I figured I’d map the potentiometer to 13 steps and see what happens. It was more about testing how I could interact with the data physically, using whatever tools I had lying around. The code itself is super basic—it just checks if the current step has changed and then sends that info over serial. It felt like a small but useful first step.

Also i integrated a distance modulino already thinking about how i could use this one for my prototype.

With a very basic setup from the library, to get the input of the sensor. I wrote a sketch that just triggers true or false when i move my hand over the sensor. I am thinking about my very first idea of the design week, to trigger an interaction/visualisation when i step on a plate with the shape of the country I want to see the emission data of. Maybe I can go in this direction this time? I want to give you another picture to show you what I mean.

Of course, this will not be realizable now but thinking about the map interaction could be a good concept for the technological boundaries I have set with my pieces I got from the FH.

#1 Topic Introduction: Looking at CO2 Emissions in Austria

During a past project, I started working with data about Austria’s annual CO2 emissions. I created my own dataset using global emission data, filtered down by country and year—all done with Python, which I was using for the first time, very interesing technology—so convenient. It was a bit of a learning curve, but also really cool to see the results take shape.

One thing that stood out was how certain moments in history, like war times, had a visible effect on the emission levels. That connection between historical events and environmental data got me thinking: how can I turn this into something people can interact with and experience beyond just reading numbers?

From Makey Makey to Arduino

I started with a simple setup using Makey Makey to build a basic interaction. It worked for a quick demo, but I quickly realized I wanted more control and flexibility. So now, I’m shifting to Arduino. I found a few components at the FH lab and I’m planning to use those to build something more responsive and physical. I’m not totally sure yet how I want everything to work, but I’m interested in seeing how these parts could represent parts of the data—like maybe scrubbing through time or showing intensity of emissions with light or movement.

Just Starting to Explore

Right now, I don’t have a clear final concept, and I’m okay with that. This part of the process is more about experimenting, testing out ideas, and seeing what happens when the data meets the physical world. I think there’s a lot of potential in making climate data more tangible—not just for me, but for others who might interact with it. So my next step is to start playing with the Arduino board, hook up the sensors, and just try stuff. Maybe something will click, maybe I’ll go in a totally new direction. Either way, I’m curious to see where it leads.

#15 Building a pocket sized tactile flood map

Three cups of coffee, an A4 sheet of foam board, and a stack of scavenged textures later, I finally have a first physical model of flood risk in the Tulln area. It is rough, flimsy in places, and already shedding, but it’s also the most concrete (and tactile!) expression of my idea so far.


Choosing “A4” over “A-Lot”

I promised myself to work small this time. An ~A4 footprint forces ruthless simplification:

  • Only the Danube’s immediate floodplain.
  • No elevation gain because there is almost none in that area.
  • 2 flood scenario (HQ 30 & HQ 100).

That constraint kept the materials list tight and the cutting tolerable with a hobby knife.


Thirty-Minute Build

  1. Print → Trace → Cheat Printer died, so I traced the WISA map contours right off my screen onto scrap paper, then onto materials—eyeballing when necessary.
  2. Knife workQuick, approximate cuts of cardboard, cork, felt, and foam.
  3. Base & WaterCraft-foam ribbon for the Danube; its cool, slick surface instantly stands out.
  4. Land UsesFelt for green, cork for sealed areas. Simple rectangles keep the skyline abstract.
  5. Flood OverlaysRough side of each sponge = HQ 30; soft cellulose side = HQ 100. Cut to match the WISA outlines and glued as over-lays.

Total build time: ~30 minutes.


First Blind Pass

With eyes closed I traced from river outward:

  • Foam river – instantly identifiable.
  • Rough sponge – HQ 30; its grit jolts the fingertip.
  • Soft sponge – HQ 100; squishy, cooler, clearly distinct.
  • Felt – forgiving, farmland vibe.
  • Cork – rigid and grainy; screams “built-up.”
  • Cardboard steps – subtle, but enough curb-height to prove the land does rise.

What I Learned

  • At A4 scale every millimetre matters. Flood zones have to be chunky enough to feel but not so thick they dwarf the elevation logic.
  • Textures communicate hierarchy if the height difference is consistent. Soft-but-low worked only when the sponge sat at the same level as the surrounding terrain.
  • Material memory is powerful. Sandpaper felt “urban” without explanation, reaffirming research on intuitive texture cues.

Further thoughts

  1. Movable Sponge OverlaysCut each HQ zone as a separate, magnet-backed piece. Users can lift, align, or stack them to see extent differences.
  2. Sliding FilmPrint HQ 30 and HQ 100 outlines on transparent acetate (raised ink or puff-paint). Slide the film over the base map; tactile bumps show where water spreads further.
  3. Stackable “Risk Chips”Punch small, uniform discs out of sponge: light-touch discs for HQ 100, rough discs for HQ 30. Drop them into a recessed Danube channel to build a tactile bar-chart of depth along chosen transects.
  4. Add a braille / raised-symbol legend to the bottom edge.
  5. Run a short thinking-aloud test with at least three users, including one low-vision participant.

14. Prototyping an Exhibition with Intelligent Decay

Define the Core Experience

Before any code or visuals, I need to be clear about the emotional arc of the installation. The users would be free to feel peace, tension, or any emotion, which would make the space restorative (biophilic), provocative (biophobic).

Build the Decay Engine

This is the technical heart of the project. I’m designing a system that remembers and changes based on how it’s treated through inputs like the time spent in front of the work; motion, sound, or proximity and speed, frequency, or intensity of interaction.

The outputs would resolve into blur, color shift, fragmentation, erosion of digital textures and the sound could be detuning, fading, glitching.
Tools I’m considering for a final product are TouchDesigner, Max/MSP with OSC (for generative sound) and Sensors (motion, mic, or camera input)

Micro-Prototypes

Rather than build the full system at once, I’ll start with small sketches like a digital painting that becomes more glitchy if you interact with it.