The installation was presented on February 22 at ESC Medien Kunst Labor as part of the master’s exhibition “Overlays” (CMS, FH Joanneum).
To strengthen the conceptual layer of the work, I deliberately chose not to use headphones or conventional loudspeakers. Instead, I used two horn loudspeakers (model shown in the figures). Such speakers are commonly used in stadiums or public announcement systems and strongly resemble urban warning sirens. In addition to their visual reference, these speakers have very specific timbral characteristics: they do not reproduce frequencies below approximately 300 Hz and are highly directional, which significantly shaped the listening experience.
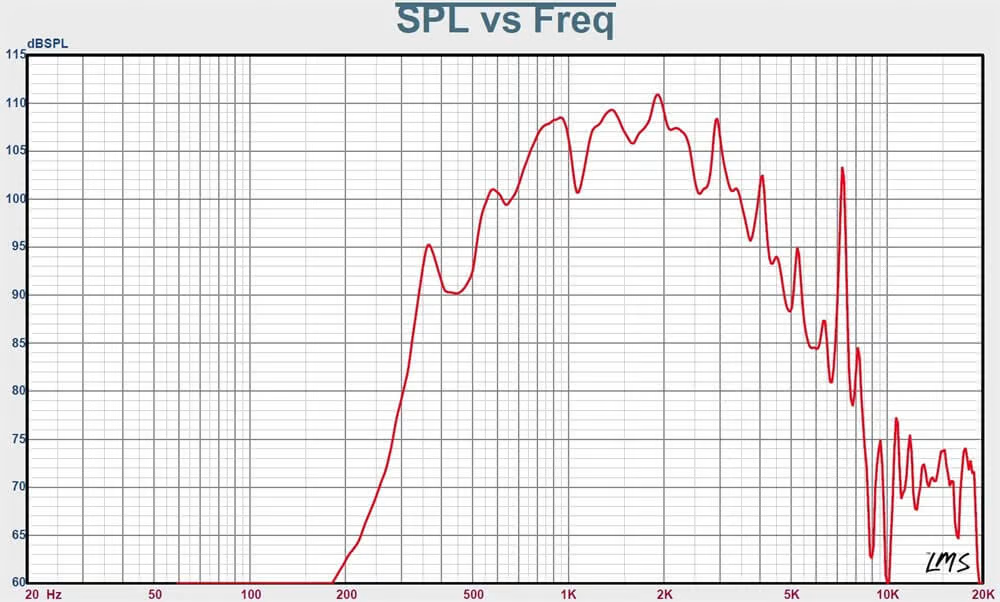
Frequency response (SPL vs. frequency) of the horn loudspeaker.
With the help of my supervisor Winfried Ritsch, who carefully calculated the required voltage, it was possible to safely connect the horn speakers to a standard OR.M CS-PA1 amplifier.
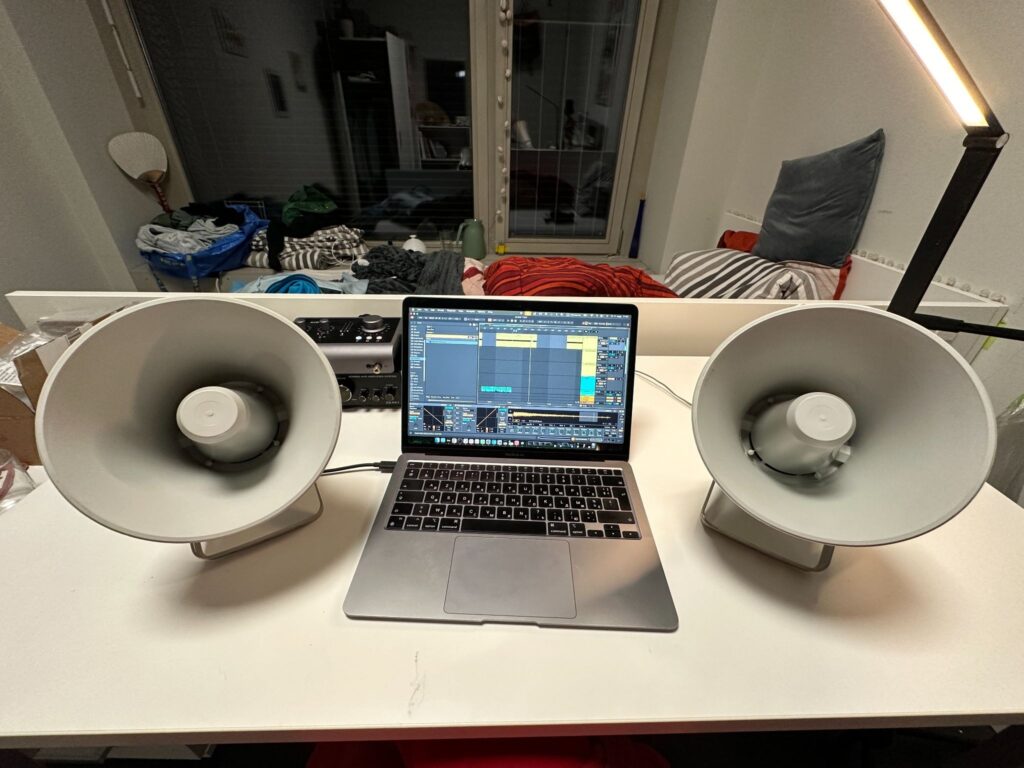
Test setup for horn loudspeakers during home prototyping.
https://dnh.no/products/hp-15t/
The speakers were suspended from the ceiling using metal chains attached to a metal truss structure, with a distance of approximately 120 cm between them. This spatial arrangement allowed visitors to physically enter the installation and stand between the speakers, experiencing the sound directly and bodily.


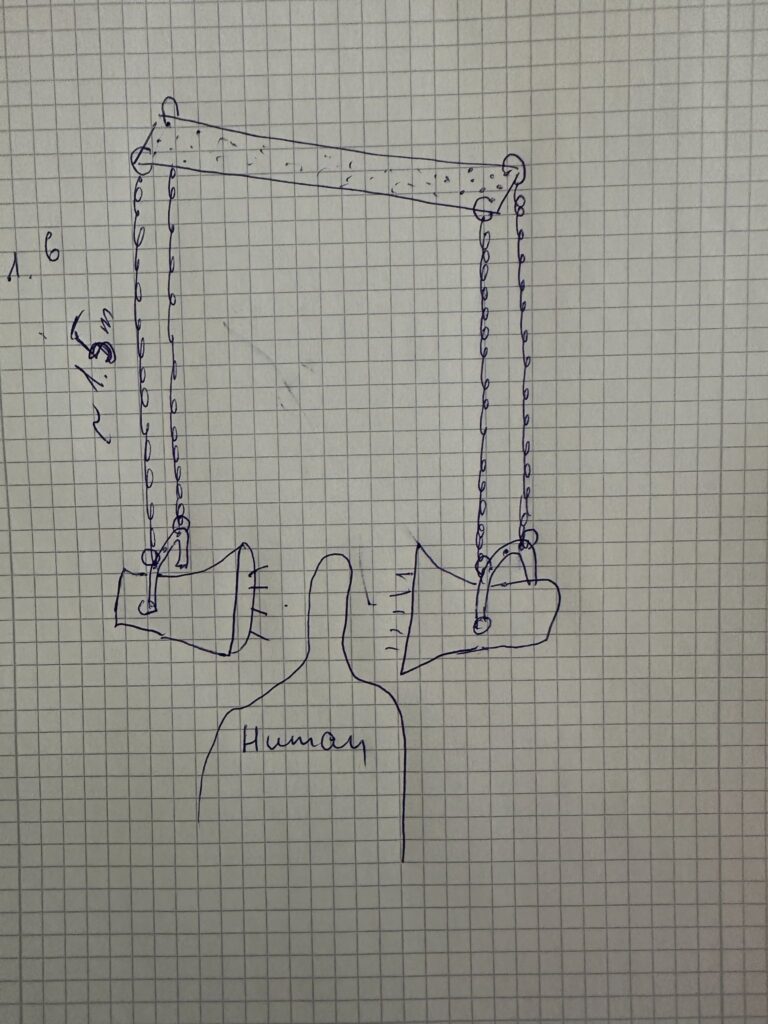
Installation layout sketches and spatial arrangement of sound sources and projection
The visual and spatial elements were arranged so that the light from a projector was directed toward the wall and the speakers in a way that their shadows became visible. The projected human silhouette was positioned between the shadows of the speakers, creating a layered visual composition that added a poetic and symbolic dimension to the installation.

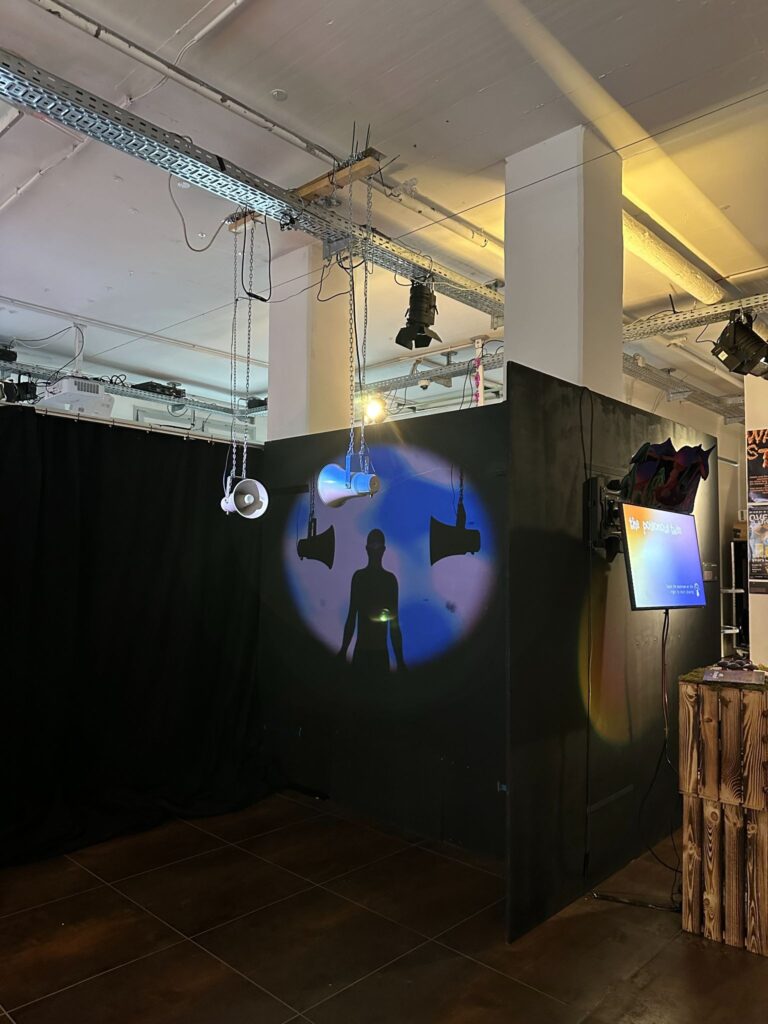
Installation in the exhibition space.
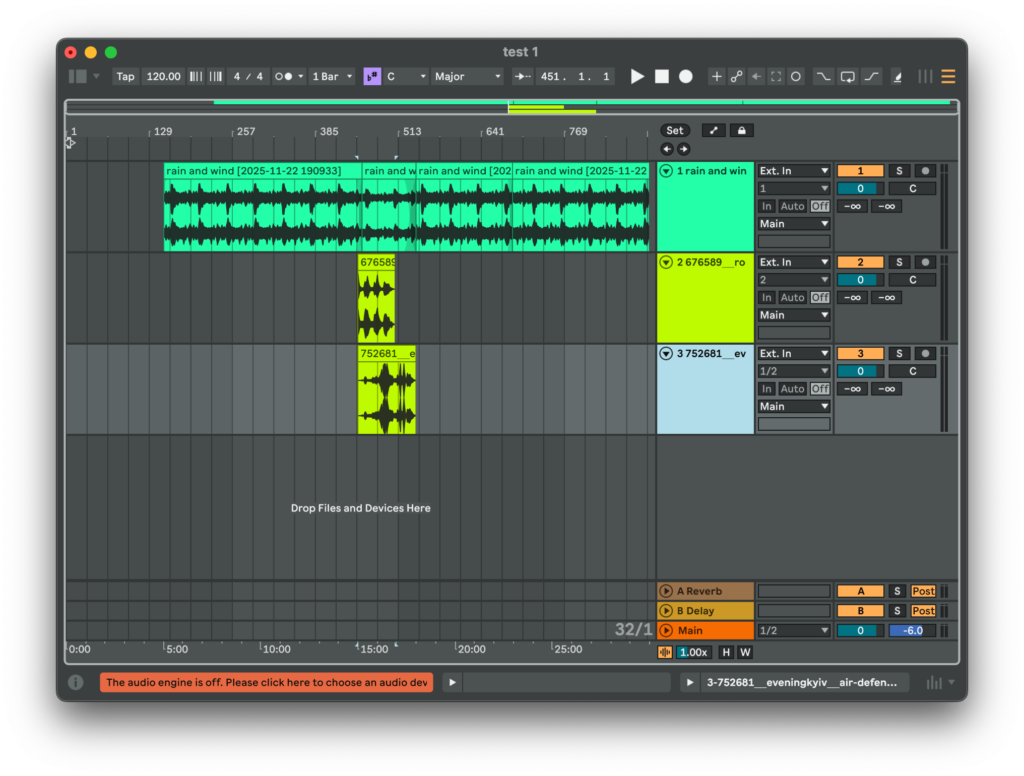
For playback, a simple media player was used, running a pre-rendered video file that already contained the synchronized audio. This decision significantly simplified the technical setup and ensured stable operation throughout the exhibition.
I would like to express special thanks to Gregor Schmitz, who assembled and installed the work. During the installation days, I was ill with influenza and had a high fever, which made it impossible for me to be physically present. Thanks to his persistence and careful work, the installation functioned reliably for the entire duration of the exhibition.
Conclusions
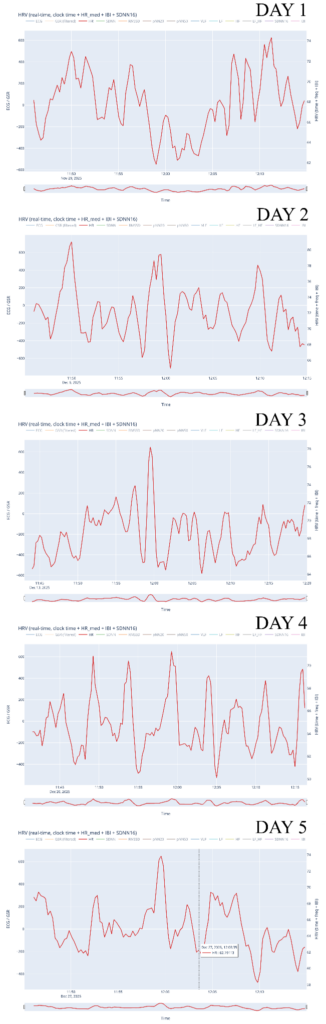
This project successfully combined physiological data analysis, sound design, and spatial installation into a coherent artistic system. One of its strongest aspects was the conceptual consistency between data, sound, and visual form. The use of HRV parameters as a driving force for both audio and visual processes created a clear and readable connection between bodily states and their artistic representation. The choice of horn speakers, their spatial placement, and their strong directional and timbral characteristics effectively reinforced the conceptual reference to sirens and public warning systems, adding both physical presence and symbolic weight to the installation. The decision to render audio and video together into a single media file also proved practical and reliable for exhibition conditions, significantly simplifying setup and playback.
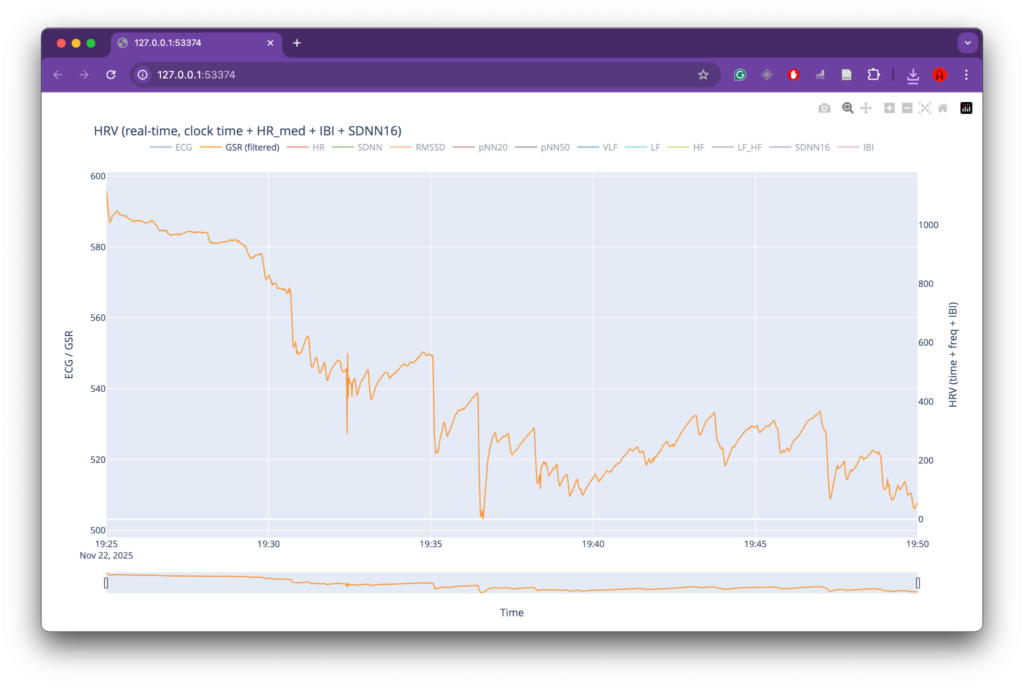
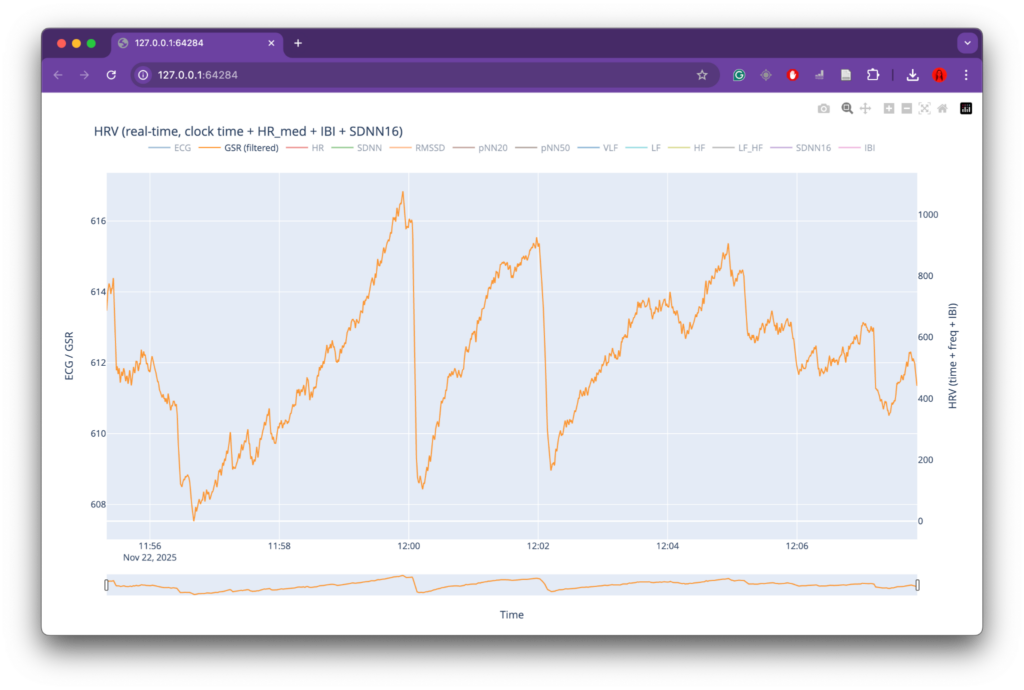
At the same time, several limitations became apparent, primarily related to data collection. While the overall data-processing and mapping workflow functioned as intended, the preparation phase for recording physiological data could have been more rigorous. The number of recordings was relatively limited, which reduced the robustness and representativeness of the dataset. In addition, recording conditions were not always fully controlled or stable, leading to inconsistencies and, in some cases, unusable data (such as the GSR measurements). These issues directly affected the range and reliability of parameters available for mapping and constrained the expressive potential of the system.
For future iterations, the most important improvement would be a more structured and controlled data-recording phase. This includes conducting a larger number of recordings, ensuring consistent environmental conditions, and clearly defining recording protocols in advance. More stable sensor placement, longer-term recordings, and repeated sessions under comparable conditions would significantly improve data quality and allow for deeper comparative analysis. With a more robust dataset, the mapping strategies could also be refined further, enabling more nuanced and complex relationships between physiological states, sound, and visuals. Overall, the project demonstrates strong artistic and technical foundations, while also clearly indicating directions for methodological refinement and expansion in future work.