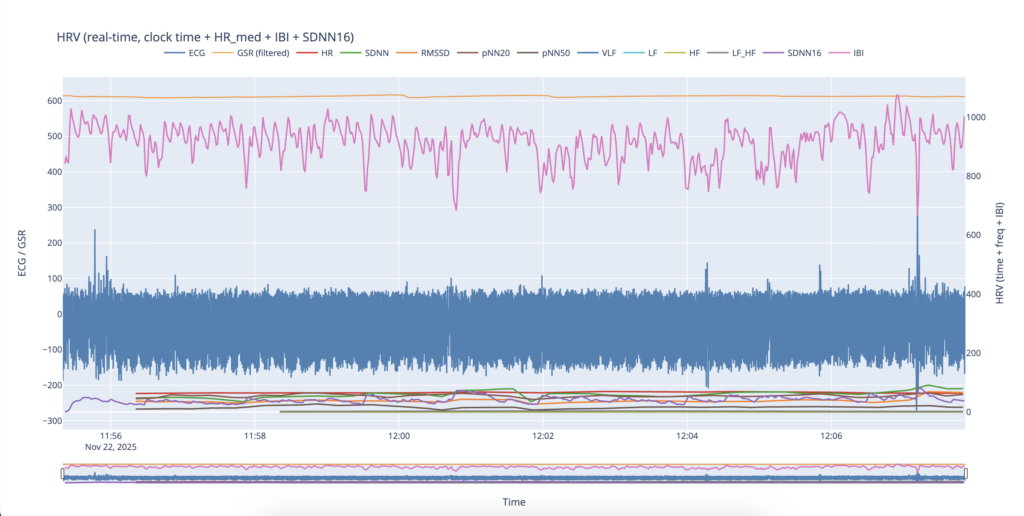
For signal inspection and analysis, I extended the Plotly-based ECG and HRV visualization tool developed during the previous semester. While the earlier version functioned well for simulated or pre-structured datasets, several adjustments were required to accommodate the properties of the new Arduino-based recordings.
The first challenge concerned the sampling rate. Unlike laboratory datasets with a fixed sampling frequency, the Arduino-based ECG stream does not produce perfectly uniform time intervals between samples. To address this, the analysis pipeline was adapted to work with a variable sampling rate derived from recorded timestamps rather than assuming a constant value. The effective sampling frequency is estimated from the median difference between successive time samples, which provides a robust approximation suitable for filtering and peak detection.
The second major modification involved time representation on the x-axis. In the previous implementation, signals were plotted against sample indices. In the current version, the visualization uses real recording time, allowing ECG, GSR, and derived HRV metrics to be aligned with the actual temporal structure of the experiment.
A third extension was the integration of the GSR signal into the plotting and analysis pipeline. Due to the high noise level observed in the raw GSR signal, basic low-pass filtering was introduced to suppress high-frequency fluctuations and improve interpretability.
Later, beyond raw signal visualization, several additional heart rate variability metrics were implemented. In addition to standard time-domain measures such as SDNN and RMSSD, the analysis includes inter-beat intervals (IBI), which represent the temporal distance between successive R-peaks. IBI is closely related to respiratory modulation of heart rate and served as an important conceptual reference, inspired by the RESonance biofeedback experiment.
Following this inspiration, SDNN16 was added as a short-term variability metric that updates continuously with each detected heartbeat. Unlike conventional SDNN, which requires longer time windows, SDNN16 provides a fast-responding measure of variability that is well suited for dynamic visualization and potential sound mapping.
Furthermore, the metrics pNN20 and pNN50 were implemented. These parameters quantify the percentage of successive beat-to-beat interval differences exceeding 20 ms and 50 ms, respectively. Both metrics offer additional insight into short-term fluctuations in heart rhythm and were included as potential control parameters for later stages of sonification.
Together, these modifications resulted in a visualization and analysis tool capable of handling irregularly sampled data, aligning physiological signals with real recording time, and providing an expanded set of HRV descriptors.