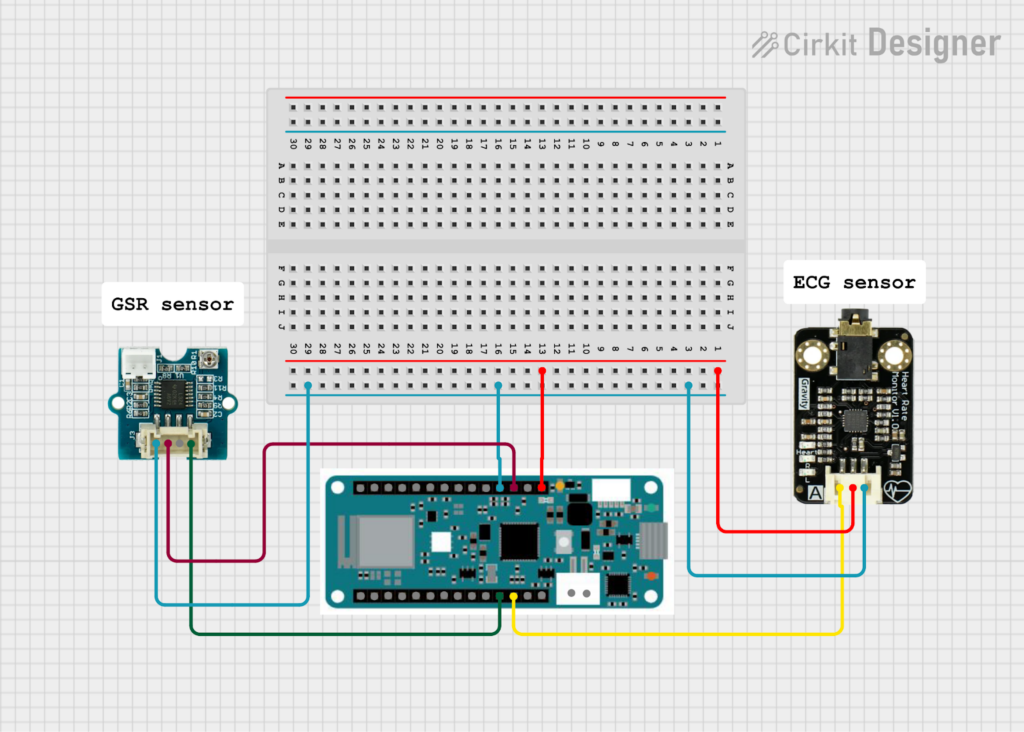
After completing the hardware setup, the next step was to verify whether the system was capable of producing usable physiological signals. For this purpose, a minimal Arduino sketch was written to read raw analog values from the ECG and GSR sensors and stream them via the serial interface. The goal at this stage was not data recording or analysis, but a basic functional test of the signal paths. The code continuously reads the ECG signal from analog input A1 and the GSR signal from analog input A2, printing both values as comma-separated numbers to the Serial Monitor. A short delay was introduced to limit the sampling rate and ensure stable serial transmission.
const int ecgPin = A1;
const int gsrPin = A2;
void setup() {
Serial.begin(115200);
}
void loop() {
int ecgValue = analogRead(ecgPin);
int gsrValue = analogRead(gsrPin);
// print CSV row: ecg,gsr
Serial.print(ecgValue);
Serial.print(“,”);
Serial.println(gsrValue);
delay(5);
}
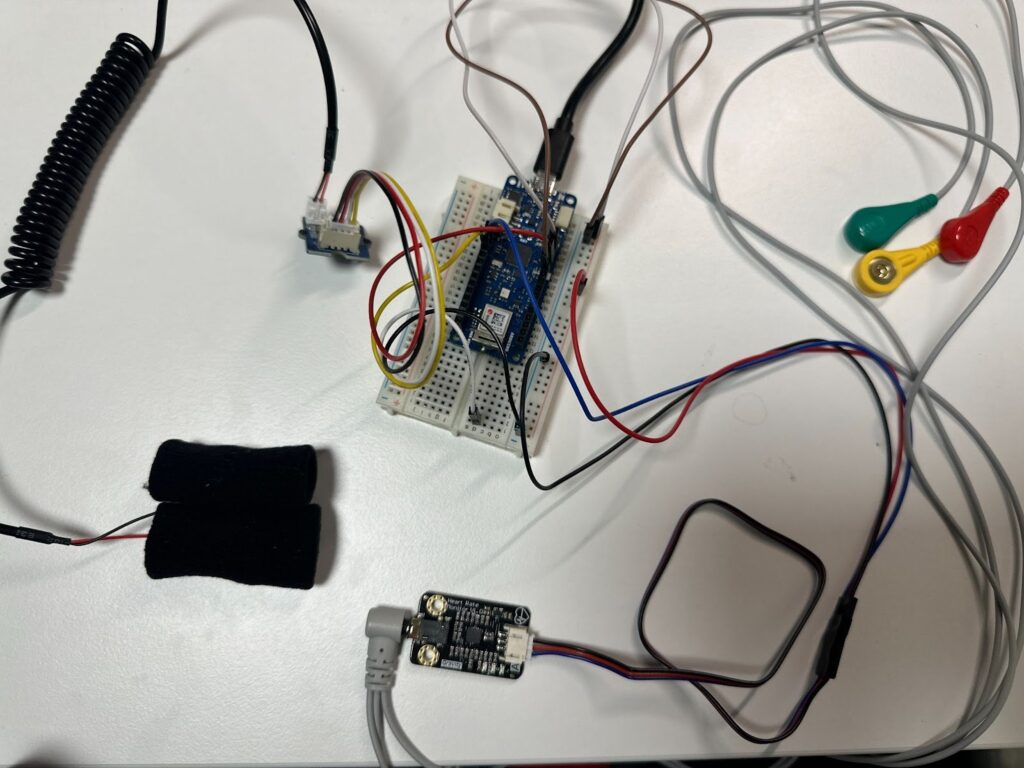
Once the code was running, the next critical step was the physical placement of the ECG electrodes. This proved to be one of the most challenging parts of the initial testing phase. Online sources provide a wide range of DIY electrode placement schemes, many of which are inconsistent or oversimplified. In particular, a previously referenced HRV-related Arduino project suggested placing electrodes on the arms. This configuration was tested first, but the resulting signal made it difficult to identify clear R-peaks in the serial plotter, which are essential for ECG interpretation and HRV analysis.
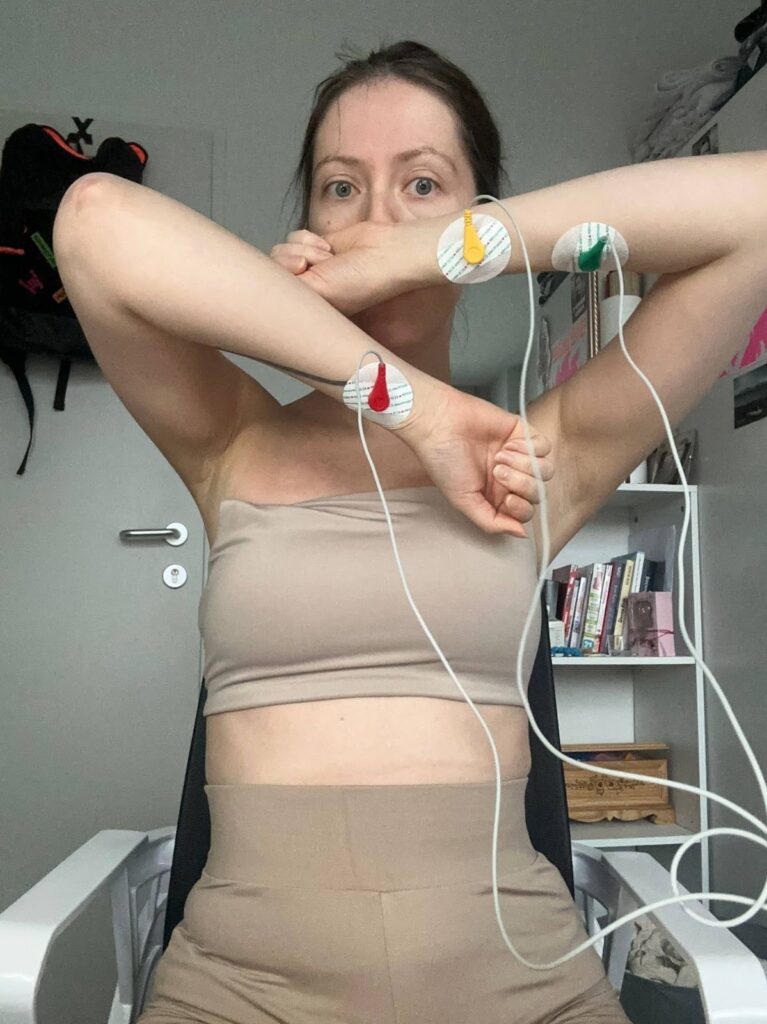
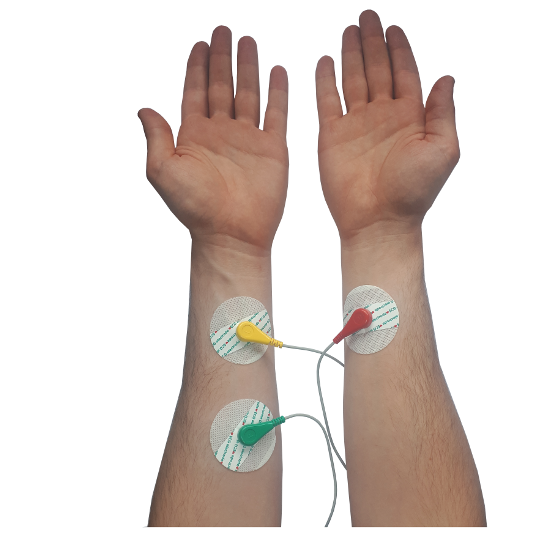
Example of ECG electrode placement as proposed in the “Arduino and HRV Analysis” project and author’s implementation. https://emersonkeenan.net/arduino-hrv/
The official documentation of the ECG sensor instead recommended chest-based electrode placement. However, this approach also required careful positioning to achieve a clean signal.
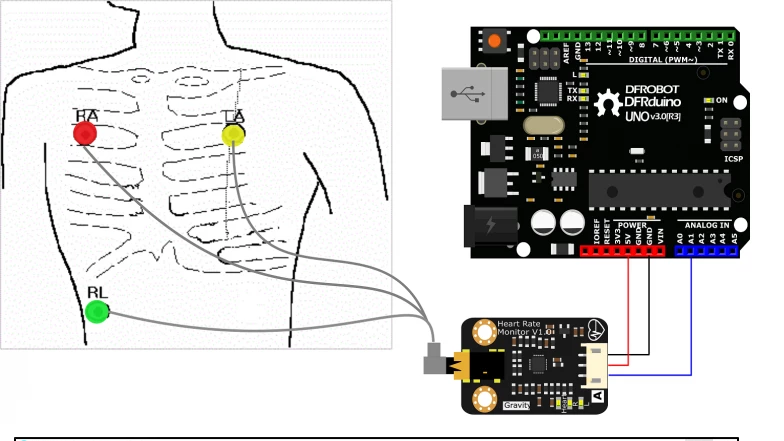
ECG electrode placement on the chest as recommended in the official sensor documentation.
https://www.dfrobot.com/product-1510.html
The most reliable guidance was found in a tutorial video presented by a medical professional, which explained proper ECG electrode placement in practical terms. The key insight was that electrodes should not be placed directly on bone. Instead, they must be positioned on soft tissue—below the shoulder and above the rib cage.
The ECG cables were clearly labeled by the manufacturer:
L (left) electrode placed on the left side of the chest
R (right) electrode placed symmetrically on the right side
F (foot/reference) electrode placed on the lower left abdomen, below the rib cage
Additionally, skin preparation proved to be essential. Degreasing the skin before attaching the electrodes significantly improved signal quality. After applying these corrections and restarting the Arduino sketch, distinct ECG peaks became clearly visible in the serial output.
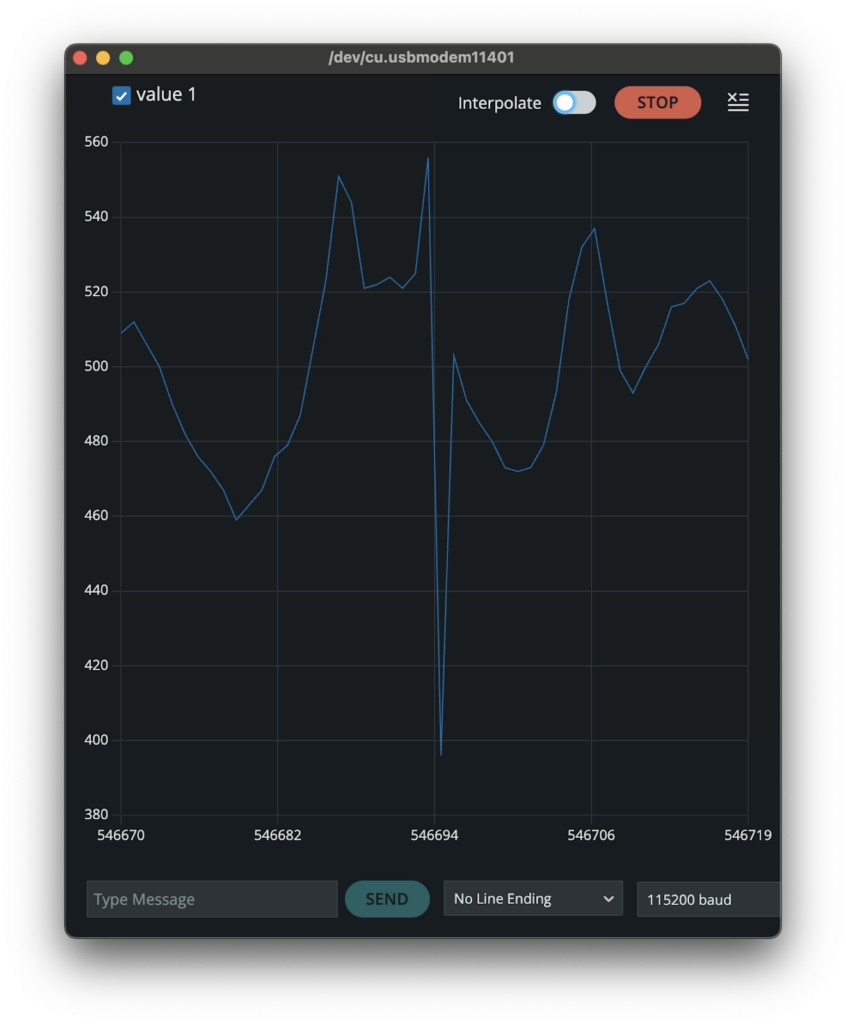
Raw ECG signal displayed in the Serial Plotter, showing clearly identifiable R-peaks during initial signal testing.
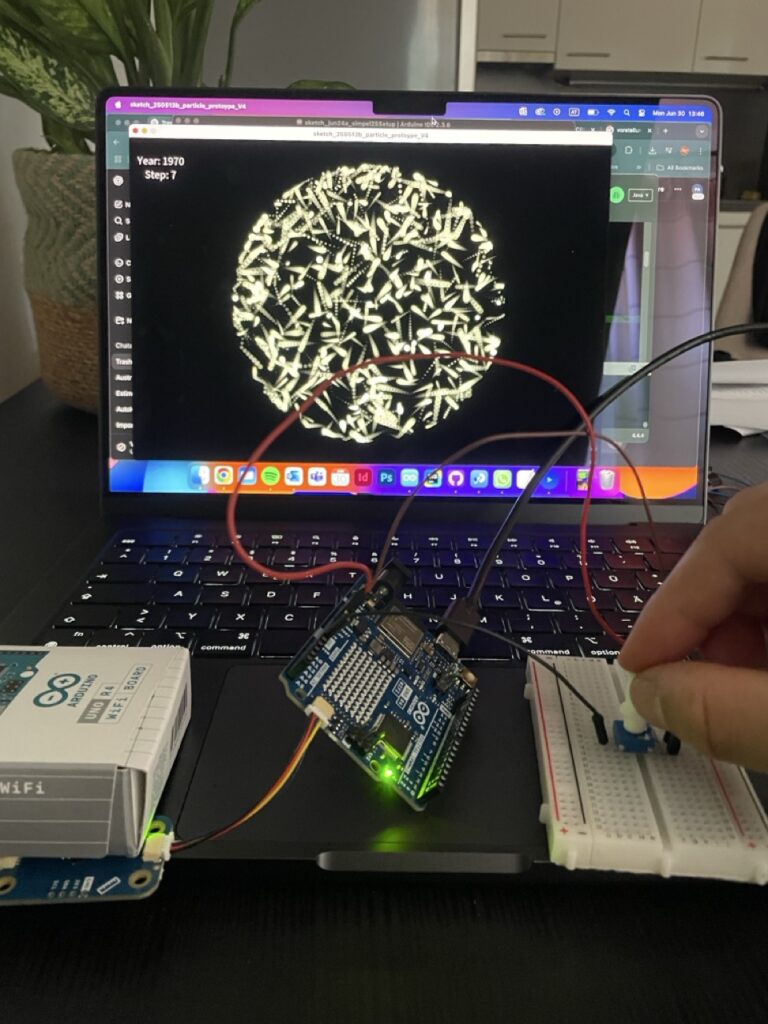
In contrast, the GSR sensor required far less preparation. It was simply attached to the fingers, and a signal was immediately observable. However, even during these initial tests it became evident that the GSR signal was highly noisy and would require filtering and post-processing in later stages of the project.
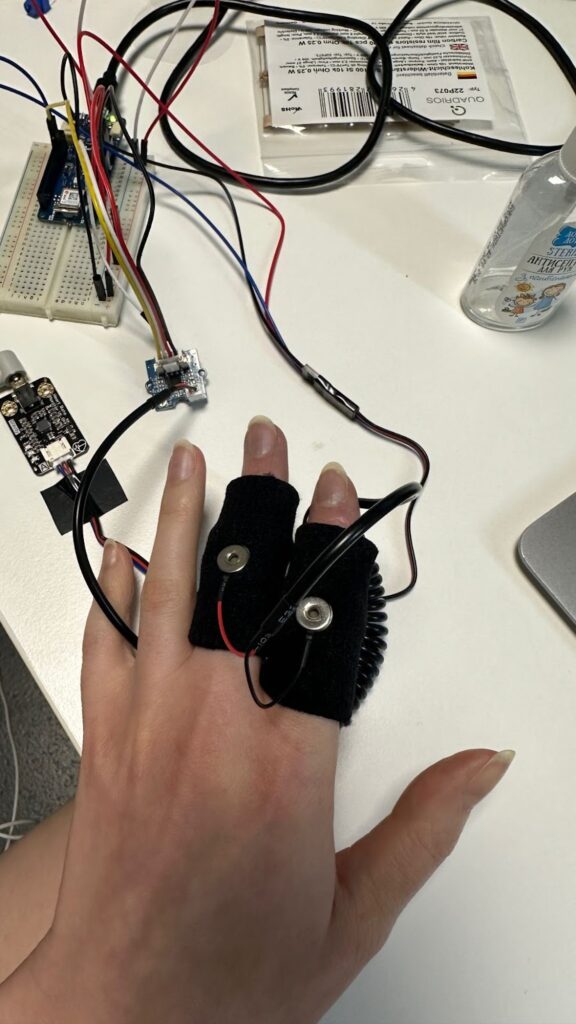
GSR sensor placement on the fingers during data acquisition.
Several practical limitations of the Arduino IDE became apparent during this testing phase. One major drawback was the inability to adjust the grid or scaling in the Serial Plotter, which made live signal inspection inconvenient. Furthermore, the current version of the Arduino IDE no longer allows direct export of serial data to CSV format from the monitor. This limitation necessitated additional tooling and custom scripts in later stages to enable proper data logging and analysis.