How do we encourage individuals to adopt more sustainable digital habits? One way to find out is by testing the effectiveness of tools designed to raise awareness. A/B testing is a proven method for evaluating whether such tools—like an app to track your digital footprint—can lead to meaningful behavior changes.
In this blog post, I’ll explain the basics of A/B testing, how I plan to use it to test a digital footprint tracker, and share examples of similar research that demonstrate the power of controlled experiments in behavioral studies.
What is A/B Testing?
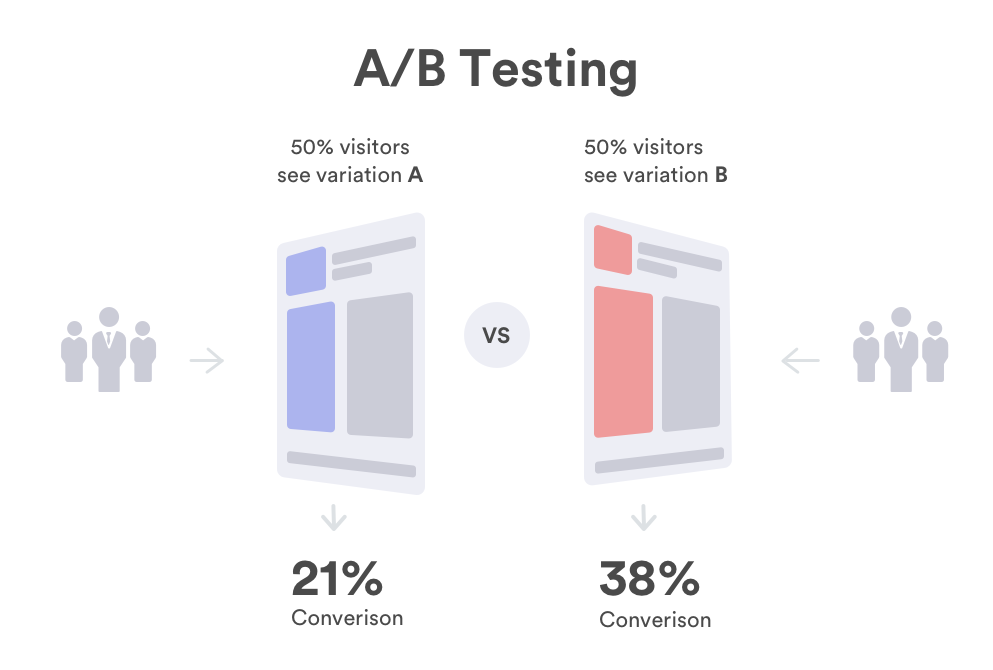
A/B testing is a method of comparing two groups to evaluate the impact of a specific variable. Group A receives the intervention or tool being tested (in this case, the digital footprint tracker), while Group B serves as a control and does not receive it. After a predetermined period, the behaviors, attitudes, or results of the two groups are compared to assess the tool’s effectiveness.
For example, in the context of my proposed app, Group A would use the app to monitor their digital footprint for a set period (e.g., one week or one month). Group B would continue with their regular digital habits without any additional awareness tools.
The Hypothesis
The hypothesis driving this test could be:
“Users who track their digital footprint through the app will demonstrate greater awareness of their digital energy consumption and reduce unnecessary usage compared to users who do not have access to the tracker.”
Designing the A/B Test
- Recruiting Participants
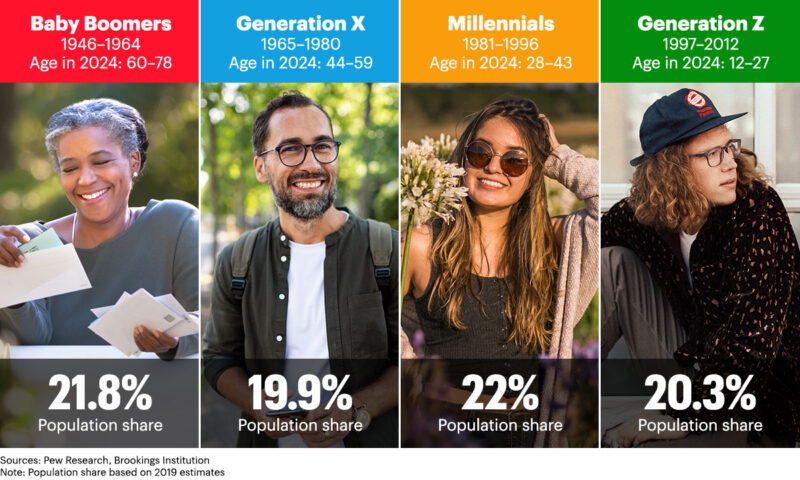
A diverse group of participants would ensure a representative sample. Ideally, this would include individuals with varying levels of digital usage and environmental awareness. - Intervention (Group A)
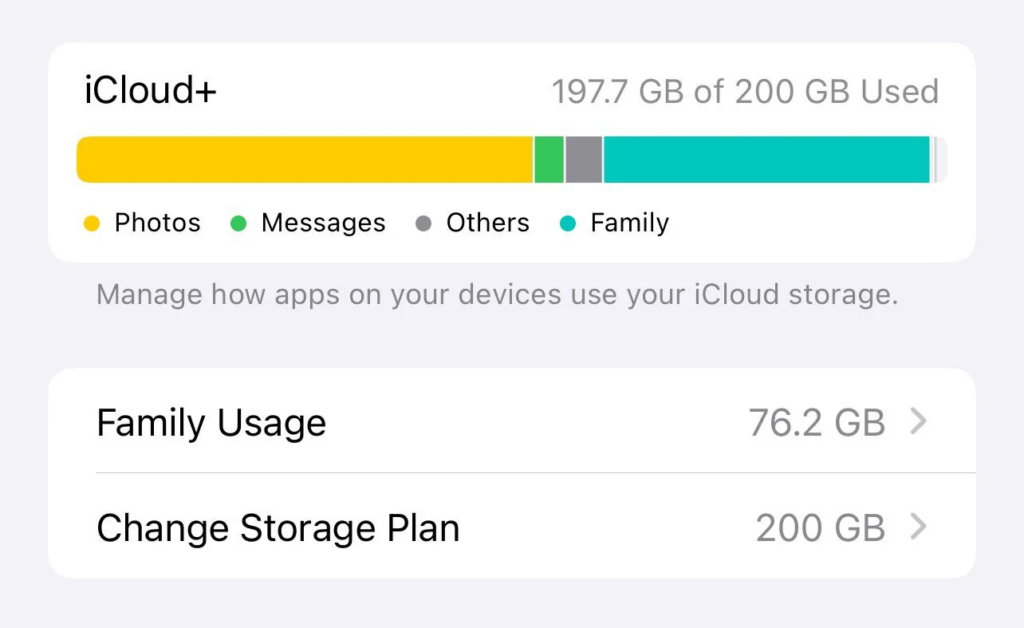
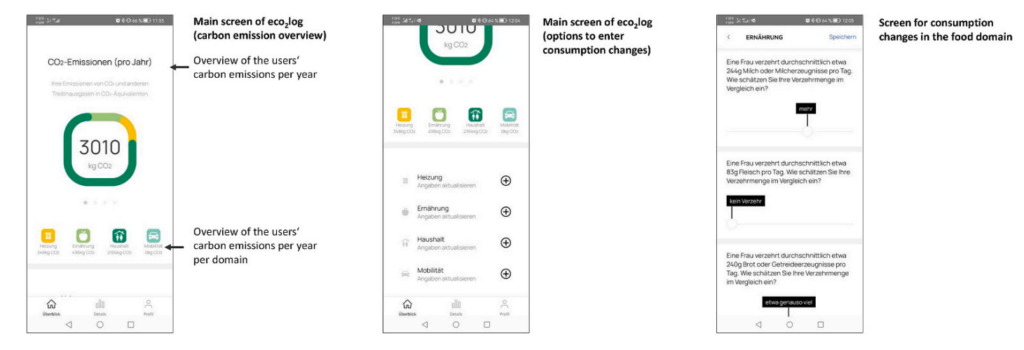
Group A would be introduced to the app, which would allow them to track activities like time spent on social media, streaming, cloud storage usage, and the corresponding carbon emissions. The app could also provide tips for reducing their footprint. - Control (Group B)
Group B would not use the app and would continue with their regular habits. - Metrics to Measure
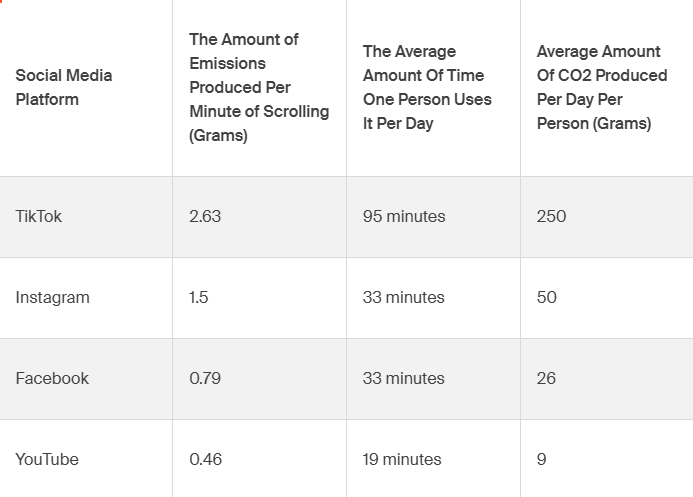
Metrics could include:- Average time spent on digital activities (e.g., social media, streaming).
- Volume of data stored or transferred (e.g., cloud usage).
- Self-reported awareness of their digital energy impact (via surveys).
- Analysis
After the testing period, compare the two groups’ behaviors. Did Group A reduce their digital energy consumption more than Group B? Did awareness levels increase? The results would indicate whether the app was effective in driving behavioral change.
Examples of Similar Research
Several studies and experiments have demonstrated the value of A/B testing in behavioral science:
Energy Usage Feedback
A widely cited study by Allcott and Rogers (2014) measured the impact of providing households with real-time feedback about their energy consumption. Households that received feedback via an energy-monitoring device reduced their electricity usage by 2-4% compared to the control group.
Health and Fitness Trackers
Research on fitness trackers shows that users who monitor their steps and activity levels are more likely to engage in physical exercise than those who do not use tracker. This aligns with the principle that awareness can lead to behavior change.

Digital Well-Being Studies
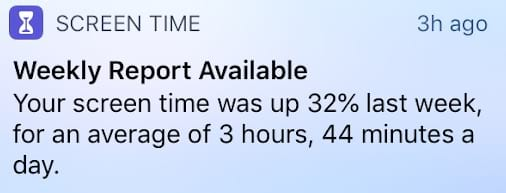
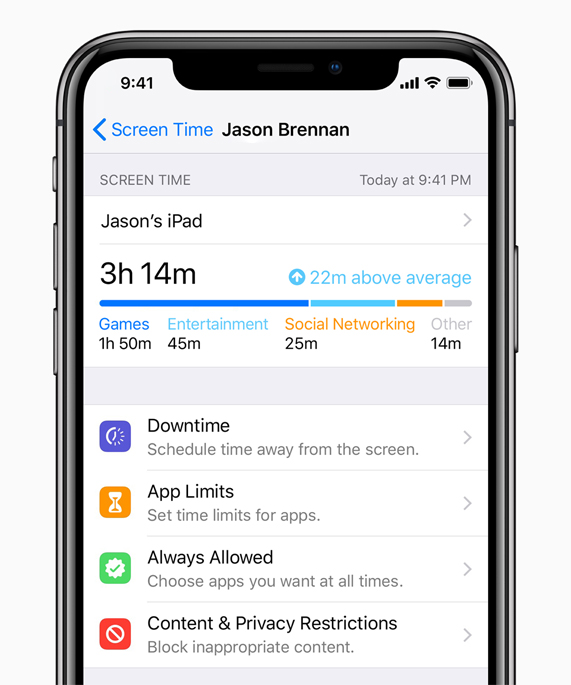
In a study focused on reducing screen time, researchers tested the effects of apps designed to monitor phone usage. Participants who received weekly reports about their screen time reduced their usage by 20% compared to those who did not receive feedback.
Challenges to Consider
While A/B testing is highly effective, it’s important to consider potential challenges:
- Sample Bias: Participants may alter their behavior simply because they know they’re being observed (the Hawthorne effect).
- Consistency: Ensuring that both groups adhere to the test conditions is crucial for accurate results.
- Long-Term Impact: Measuring behavior change over a longer period (beyond one week or one month) may require additional follow-ups.
Using A/B Testing to Inspire Awareness
The results of this test could inform the design and functionality of the digital footprint tracker. For instance:
- If Group A reduces their cloud usage, the app could highlight the most impactful actions users can take.
- If awareness alone is insufficient, the app could incorporate behavioral nudges, such as gamification or rewards for sustainable habits.
Ultimately, the findings could shape not just this app but broader efforts to raise awareness about the environmental impact of digital activities.
Conclusion
A/B testing provides a scientific and measurable way to evaluate whether tools like a digital footprint tracker can drive awareness and behavior change. By comparing the actions of two groups, we can gain valuable insights into what motivates people to adopt more sustainable habits—and how design can play a role in fostering awareness.
Resources:
https://publications.jrc.ec.europa.eu/repository/bitstream/JRC133518/JRC133518_01.pdf?utm_source
(PDF) Effectiveness of behavioural interventions to reduce household energy demand: A scoping review


