Have fun with this Video to find out what my actual Prototype is.
Reflection
This project began with a vague idea to visualize CO₂ emissions — and slowly took shape through cables, sensors, and a healthy amount of trial and error. Using a potentiometer and a proximity sensor, I built a simple system to scroll through time and trigger animated data based on presence. The inspiration came from NFC tags and a wizard VR game (yes, really), both built on the idea of placing something physical to trigger something digital. That concept stuck with me and led to this interactive desk setup. I refined the visuals, made the particles feel more alive. I really want to point out how important it is to ideate and keep testing your ideas, because there will always be changes in your plans or something won’t work etc. Let’s go on summer vacation now 😎
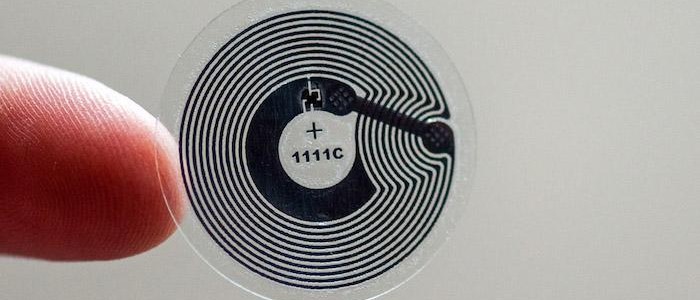
Over the past few weeks, this project slowly evolved into something that brings together a lot of different inspirations—some intentional, some accidental. Looking back, it really started during the VR project we worked on at the beginning of the design week. We were thinking about implementing NFC tags, and there was something fascinating about the idea that just placing an object somewhere could trigger an action. That kind of physical interaction stuck with me.
NFC Tag
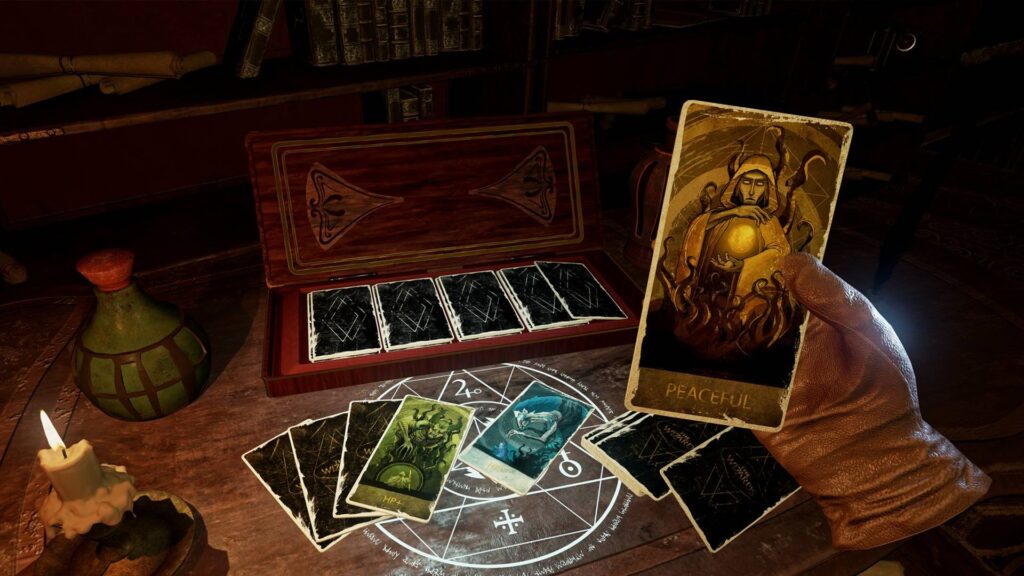
Around the same time, we got a VR headset to develop and test our game. While browsing games, I ended up playing this wizard game—and one small detail in it fascinated me. You could lay magical cards onto a rune-like platform, and depending on the card, different things would happen. It reminded me exactly of those NFC interactions in the real world. It was playful, physical, and smart. That moment clicked for me, I really like the idea that placing something down could unlock or reveal something.
Wizard Game
Closing the Circle
That’s the energy I want to carry forward into the final version of this project. I’m imagining an interactive desk where you can place cards representing different countries and instantly see their CO2 emission data visualized. For this prototype, I’m keeping it simple and focused—Austria only, using the dataset I already processed. But this vision could easily scale: more countries, more visual styles, more ways to explore and compare. Alongside developing the interaction concept, I also took time to refine the visualization itself. In earlier versions, the particle behavior and data mapping were more abstract and experimental—interesting, but sometimes a bit chaotic. For this version, I wanted it to be more clear and readable without losing that expressive quality. I adjusted the look of the CO2 particles to feel more alive and organic, giving them color variation, slight flickering, and softer movement. These small changes helped shift the visual language from a data sketch to something that feels more atmospheric and intentional. It’s still messy in a good way, but now it communicates more directly what’s at stake.
So far, I’ve soldered things together (mentally, not literally), tested sensors, debugged serial communication, and got Arduino and Processing talking to each other. That in itself feels like a win. But now comes the real work: What do I actually do with this setup?
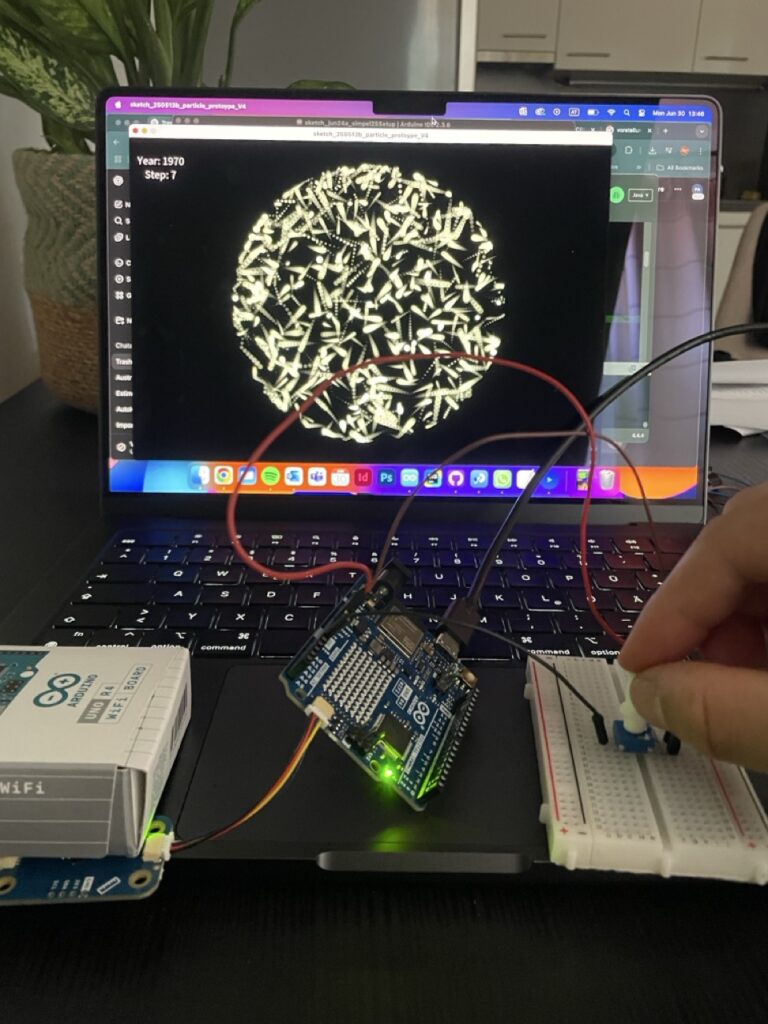
At this stage, I started combining the two main inputs—the proximity sensor and the potentiometer into a single, working system. The potentiometer became a kind of manual timeline scrubber, letting me move through 13 steps that represent a line, which should be a test for a potential timeline? The proximity sensor added a sense of presence, acting like a trigger that wakes the system up when someone approaches. Together, they formed a simple but functional prototype of a prototype, a rough sketch of the interaction I’m aiming for. It helped me think through how the data might be explored, not just visually, but physically, with gestures and motion. This phase was more about testing interaction metaphors than polishing visuals—trying to understand how something as abstract as historical emissions can be felt through everyday components like a knob and a distance sensor. This task pointed out to me, how important testing and the ideation of your ideas can be, to get a better understanding of your own thoughts and to form a more precise imagination of your plan.
Small Prototype to connect sensors in one file
Things about to get serious
Building on the knowledge I gained during the ideation phase, I connected my working sensor system, a potentiometer and proximity sensor to the Processing sketch I had developed during design week. That earlier version already included interaction through Makey Makey and homemade aluminum foil buttons, which made for a playful and tactile experience. In my opinion, the transfer to Arduino technology made the whole setup easier to handle and much cleaner—fewer cables, more direct control, and better integration with the Processing environment. The potentiometer now controls the timeline of Austria’s CO2 emissions, while the proximity sensor acts as a simple trigger to activate the visualization. This transition from foil to microcontroller reflects how the project evolved from rough experimentation into a more stable, cohesive prototype.
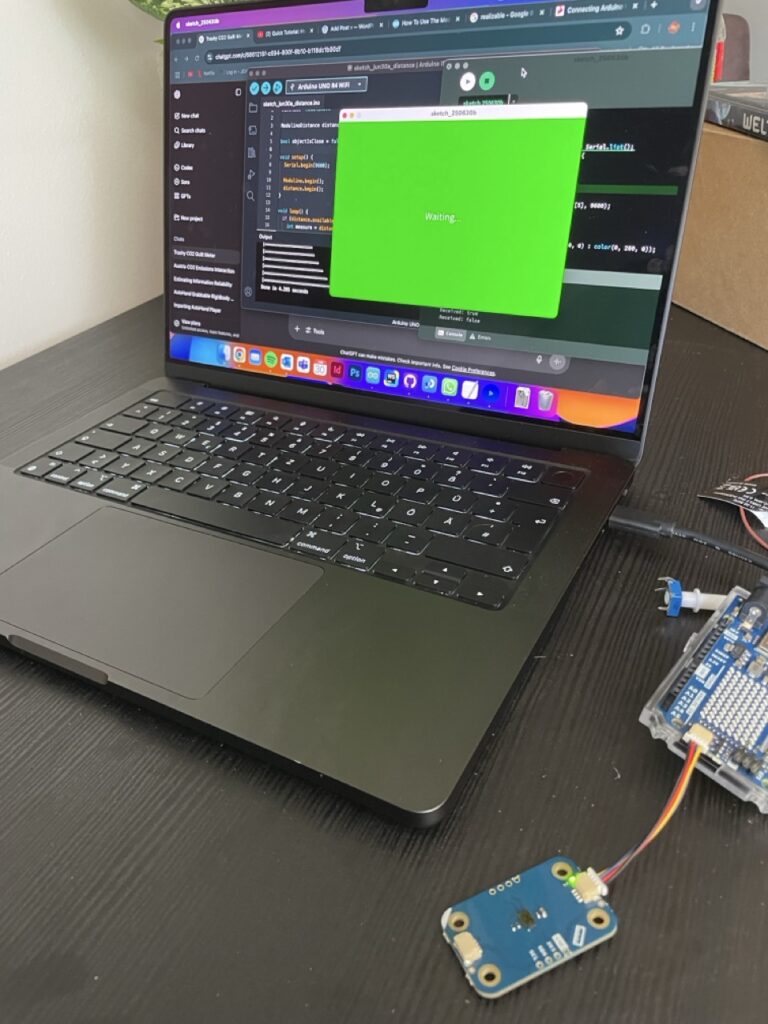
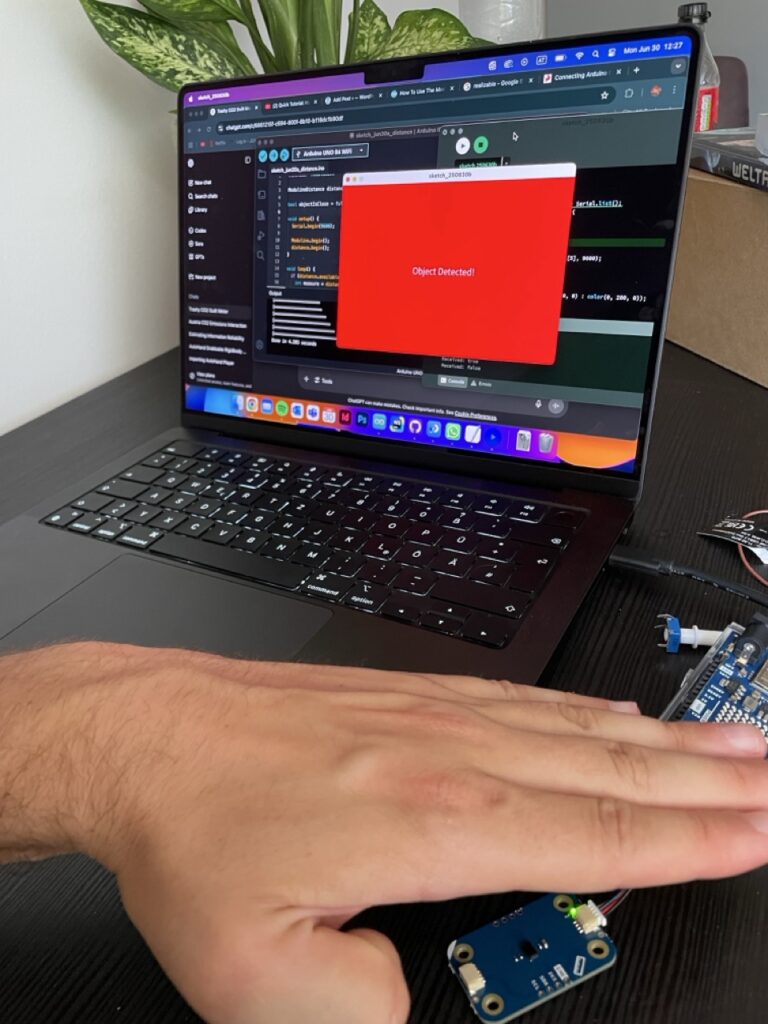
By this point, I had some sensors hooked up and was starting to imagine how my prototype might interact with Processing. But getting data from the physical world into my visuals? That’s where serial communication came in! On the Arduino side, I used “Serial.begin(9600)” to start the connection, and “Serial.println()” to send sensor values. In my case, it was messages like “true” when a hand moved close to the distance sensor, and “false” when it moved away. On the Processing side, I used the Serial library to open the port and listen for data. Every time a new message came in, I could check if it was “true” or “false”, and change what was being shown on screen — red background, green background, whatever. So I was prototyping the prototype, you could say.
Why this is so fascinating and helpful 🤯
I wanted to build something quick, easy to use and reactive—and serial communication made it possible to prototype fast without diving into WiFi, Bluetooth, or custom protocols. It lets me test ideas in minutes: turn a knob, wave a hand, watch the screen respond. And for something as conceptual and messy as visualizing CO2 history with simple and fast coding, that immediacy is everything.
Imagine you’re at an interactive museum exhibit about climate change. As a visitor approaches a screen, a hidden distance sensor detects their presence. The Arduino sends “true” to Processing, which triggers a cinematic fade-in of historical CO2 data and a narration starts playing. When the visitor steps away, the system fades back into a passive state, waiting for the next interaction. That whole experience? Driven by serial communication. One cable. A few lines of code. Huge impact.
Some helpful links for those who are interested in serial communication: