Experiment VI: Embodied Resonance – ecg_to_drum.py

To generate heart-rate–driven drums I set out to write a script that builds a drum pattern whose density depends on HR intensity. I fixed the tempo at 75 BPM because the math is convenient: 0.1 s of data ≈ one 1/32-note at 75 BPM. I pictured a bar with 16 cells and designed a map that decides which cell gets filled next; the higher the HR, the more cells are activated. Before rendering, a helper scans the global HR minimum and maximum and slices that span into 16 equal zones (an 8-zone fallback is available) so the percussion always scales correctly. For extra flexibility, the script also writes SDNN and RMSSD into the MIDI file as two separate CC automation lanes. In Ableton, I can map those controllers to any parameter, making it easy to experiment with the track’s sonic texture.

Let’s take a closer look at the code. If you want to see the full, visit: https://github.com/ninaeba/EmbodiedResonance

This script converts raw heart-rate data into a drum track.
Every 0.1-second CSV sample lines up with a 1⁄32-note at the fixed tempo of 75 BPM, so medical time falls neatly onto a musical grid. The pulse controls how many cells inside each 16-step bar are filled, while SDNN and RMSSD are embedded as two CC lanes for later sound-design tricks.

Default configuration (all constants live in one block)
 STEP_BEAT = 1 / 32  # grid resolution in beats
 NOTE_LENGTH = 1 / 32  # each hit lasts a 32nd-note
 DEF_BPM = 75    # master tempo
 CSV_GRID = 0.1   # CSV step in seconds
 SEC_PER_CELL = 0.1   # duration of one pattern cell
 SIGNATURE = "16/16" # one bar = 16 cells
 CC_SDNN = 11    # long-term HRV
 CC_RMSSD = 1    # short-term HRV

The spatial order of hits is defined by a map that spreads layers across the bar, so extra drums feel balanced instead of bunching at the start

 CELL_MAP = [0, 8, 4, 12, 2, 10, 6, 14, 1, 9, 5, 13, 3, 11, 7, 15]

generate_rules slices the global HR span into sixteen equal zones and binds each zone to one cell-and-note pair; the last rule catches any pulse above the top threshold

 def generate_rules(hr_min, hr_max, cells):
  thresholds = np.linspace(hr_min, hr_max, cells + 1)[1:]
  rules = [(thr, CELL_MAP[i], 36 + i) for i, thr in enumerate(thresholds)]
  rules[-1] = (np.inf, rules[-1][1], rules[-1][2])
  return rules

Inside csv_to_midi the script first writes two continuous-controller streams—one for SDNN, one for RMSSD—normalised to 0-127 at every grid tick

 sdnn_norm = clip((sdnn − min) / (range), 0, 1)
 rmssd_norm = clip((rmssd − min) / (range), 0, 1)
 add CC 11 with value round(sdnn_norm × 127) at time t
 add CC 1 with value round(rmssd_norm × 127) at time t

A cumulative-pattern list is built so rhythmic density rises without ever muting earlier layers

 CUM_PATTERNS = []
 acc = []
 for (thr, cell, note) in rules:
  acc.append((cell, note)) # keep previous hits
  CUM_PATTERNS.append(list(acc)) # zone n holds n+1 hits

During rendering each bar/cell slot is visited, the current HR is interpolated onto that exact moment, its zone is looked up, velocity is set to the rounded pulse value, and only the cells active in that zone fire

 hr = interp(t_sample, times, hr_vals)
 zone = first i where hr ≤ rules[i].threshold
 vel = int(round(hr))

 for (z_cell, note) in CUM_PATTERNS[zone]:
  if z_cell ≠ cell: continue
  beat = (bar × cells + cell) × STEP_BEAT × 4
  t0 = beat × 60 / bpm
  write Note(pitch=note, velocity=vel, start=t0, end=t0 + NOTE_LENGTH in seconds)


Before any writing starts the entry-point scans the whole folder to gather global minima and maxima for HR, SDNN and RMSSD, guaranteeing identical zone limits and CC scaling across every file in the batch

 hr_min, hr_max = min/max of all HR values
 sdnn_min, sdnn_max = min/max of all SDNN values
 rmssd_min, rmssd_max = min/max of all RMSSD values
 rules = generate_rules(hr_min, hr_max, cells)

Run the converter like this:

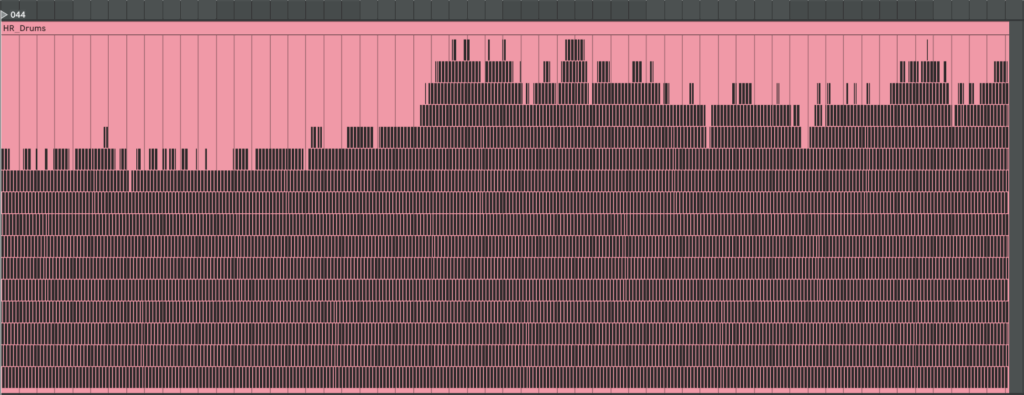
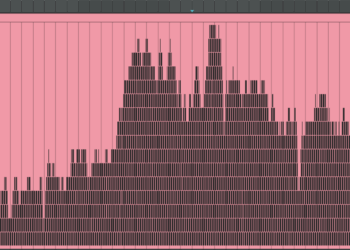
 python ecg_to_drum.py path/to/csv_folder --tempo 75 --time-signature 16/16

Each CSV becomes a _drums.mid file that contains a single drum-kit track whose note density follows heart-rate zones and whose CC 11 and CC 1 envelopes mirror long- and short-term variability—ready to animate filters, reverbs or whatever you map them to in the DAW.

Here are examples of generated MIDI files with drums. On the left side, there are drums made with individual mapping for every patient separately, and on the right side, mapping is one for all patients. We can see they resemble our HR graphs.

Experiment I: Embodied Resonance – Heart rate variability (HRV) as mental health indicator

Heart rate is a fundamental indicator of mental health, with heart rate variability (HRV) playing a particularly significant role. HRV refers to the variation in time intervals between heartbeats, reflecting autonomic nervous system function and overall physiological resilience. It is measured using time-domain, frequency-domain, or non-linear methods. Higher HRV is associated with greater adaptability and lower stress levels, while lower HRV is linked to conditions such as PTSD, depression, and anxiety disorders.

Studies have shown that HRV differs between healthy individuals and those with PTSD. In a resting state, people with PTSD typically exhibit lower HRV compared to healthy controls. When exposed to emotional triggers, their HRV may decrease even further, indicating heightened sympathetic nervous system activation and reduced parasympathetic regulation. Bessel van der Kolk’s work in “The Body Keeps the Score” highlights how trauma affects autonomic regulation, leading to dysregulated physiological responses under stress.

There are two primary methods for measuring heart rate: electrocardiography (ECG) and photoplethysmography (PPG). 

FeatureECGPPG
Measurement PrincipleUses electrical signals produced by heart activityUses light reflection to detect blood flow changes
AccuracyGold standard for medical HR monitoringUses ECG as reference for HR comparison
Heart Rate (HR) MeasurementHighly accurateSuitable for average or moving average HR
Heart Rate Variability (HRV)Can extract R-peak intervals with millisecond accuracyLimited by sampling rate, better for long-duration measurements (>5 min)
Time to Obtain ReadingQuick, no long settling time requiredRequires settling time for ambient light compensation, motion artifact correction
picsensor namelinkpricewhat it measuresspecificationfeaturesusage case
Gravity: Analog Heart Rate Monitor Sensor (ECG) for Arduinobuy$19.90electrical activity of the heartInput Voltage: 3.3-6V (5V recommended)Output Voltage: 0-3.3VInterface: AnalogOperating current: <10mAHeart Rate Monitor Sensor x1Sensor cable – Electrode Pads (3 connector) x1Biomedical Sensor Pad x6https://emersonkeenan.net/arduino-hrv/
Gravity:Analog/Digital PPG Heart Rate Sensorbuy$16.00blood volume changingInput Voltage (Vin): 3.3 – 6V (5V recommended) Output Voltage: 0 – Vin (Analog), 0/ Vin (Digital) Operating current: <10mAAnalog (pulse wave) & Digital(heart rate), configurable outputhttps://www.dfrobot.com/blog-767.html
MAX30102 PPG Heart Rate and Oximeter Sensorbuy$21.90blood volume changing + blood oxygen saturationPower Supply Voltage: 3.3V/5VWorking Current: <15mACommunication Method: I2C/UARTI2C Address: 0x57https://community.dfrobot.com/makelog-313158.html
Fermion: MAX30102 PPG Heart Rate and Oximeter Sensorbuy$15.90blood volume changing + blood oxygen saturationPower Supply: 3.3VWorking Current: <15mACommunication: I2C/UARTI2C Address: 0x57https://community.dfrobot.com/makelog-311968.html
SparkFun Single Lead Heart Rate Monitorbuy$21.50electrical activity of the heartOperating Voltage – 3.3VAnalog OutputLeads-Off DetectionShutdown PinLED Indicatorno electrodes
extra cables cost $5.50 extra electrodes $8.95
https://anilmaharjan.com.np/blog/diy-ecg-ekg-electrocardiogram 
Sparkfun: Pulse Sensorbuy$26.95blood volume changingInput Voltage (VCC) – 3V to 5.5VOutput Voltage – 0.3V to VCCSupply Current – 3mA to 4mAhttps://microcontrollerslab.com/pulse-sensor-esp32-tutorial/
SparkFun Pulse Oximeter and Heart Rate Sensorbuy$42.95blood volume changing + blood oxygen saturationI2C interface I2C Address: 0x55https://github.com/sparkfun/SparkFun_Bio_Sensor_Hub_Library
Keyestudio AD8232 ECG Measurement Heart Monitor Sensor Module buy9,25€electrical activity of the heartPower voltage:DC 3.3VOutput:analog outputInterface(connect RA, LA, RL): 3PIN, 2.54PIN or earphone jackhttps://wiki.keyestudio.com/Ks0261_keyestudio_AD8232_ECG_Measurement_Heart_Monitor_Sensor_Module

ECG records the electrical activity of the heart using electrodes placed on the skin, providing high accuracy in detecting R-R intervals, which are critical for HRV analysis. PPG, in contrast, uses optical sensors to detect blood volume changes in peripheral tissues, such as fingertips or earlobes. While PPG is convenient and widely used in consumer devices, it is more susceptible to motion artifacts and may not provide the same precision in HRV measurement as ECG.

Additionally, some PPG sensors include pulse oximetry functionality, measuring both heart rate and blood oxygen saturation (SpO2). One such sensor is the MAX30102, which uses red and infrared LEDs to measure oxygen levels in the blood. The sensor determines SpO2 by comparing light absorption in oxygenated and deoxygenated blood. Since oxygen levels can influence cognitive function and stress responses, these sensors have potential applications in mental health monitoring. However, SpO2 does not provide direct information about autonomic nervous system function or HRV, making ECG a more suitable method for this project.

For this project, ECG is the preferred method due to its superior accuracy in HRV analysis. Among available ECG sensors, the AD8232 module is a suitable choice for integration with microcontrollers such as Arduino. The AD8232 is a single-lead ECG sensor designed for portable applications. It amplifies and filters ECG signals, making it easier to process the data with minimal noise interference. The module includes an output that can be directly read by an analog input pin on an Arduino, allowing real-time heart rate and HRV analysis.

HRV is calculated based on the time intervals between successive R-peaks in the ECG signal. One of the most commonly used HRV metrics is the root mean square of successive differences (RMSSD), which is computed using the formula:

where RRi represents the ith R-R interval, and N is the total number of intervals. Higher RMSSD values indicate greater parasympathetic activity and better autonomic balance. Among ECG sensors available on the market, the Gravity: Analog Heart Rate Monitor Sensor (ECG) is the most suitable for this project. It is relatively inexpensive, includes electrode patches in the package, and has well-documented Arduino integration, making it an optimal choice for HRV measurement in experimental and practical applications.