Impulse #4: The Role of Playtesting in Game Development

Understanding Users before Building a Game

Game development today involves more than programming and visual design. The process has expanded to prioritize player experience, usability, and comfort. As a result, user research and structured game testing have become established parts of development rather than optional additions. Developers collect information about potential players’ expectations, preferred interaction styles, and prior gaming experience. These findings help define the core direction of the project, informing mechanics, interface design, and accessibility considerations.

The Role of Continuous Playtesting

Playtesting follows throughout production. During testing, participants play the game while developers evaluate how easy it is to understand controls, complete objectives, and maintain engagement. Feedback may take the form of performance metrics, interviews, or surveys. Insights gathered from testing lead to adjustments in difficulty, interface structure, pacing, and overall design. By repeating this cycle of testing and refinement, developers aim to reduce friction and improve player satisfaction prior to release.

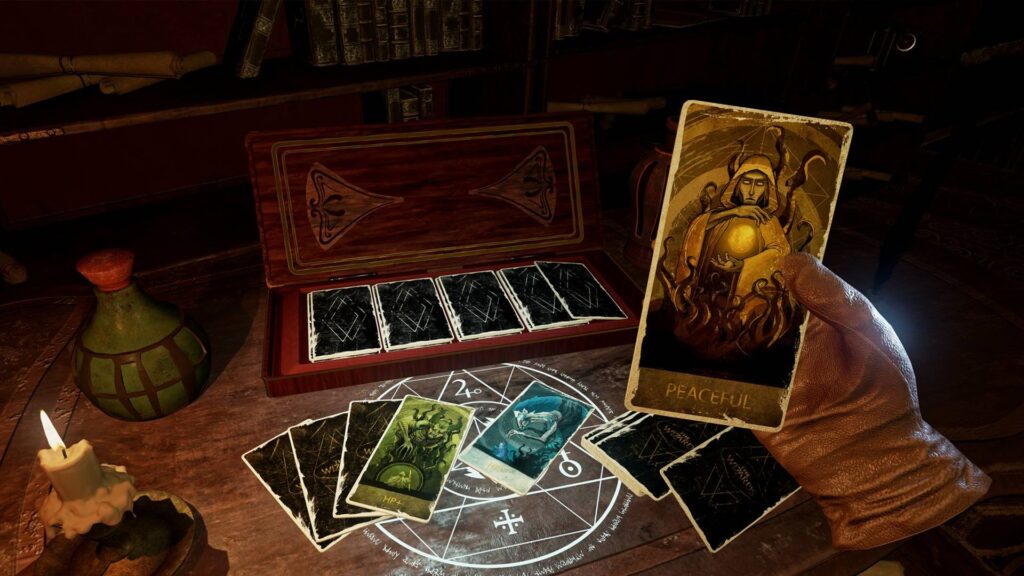
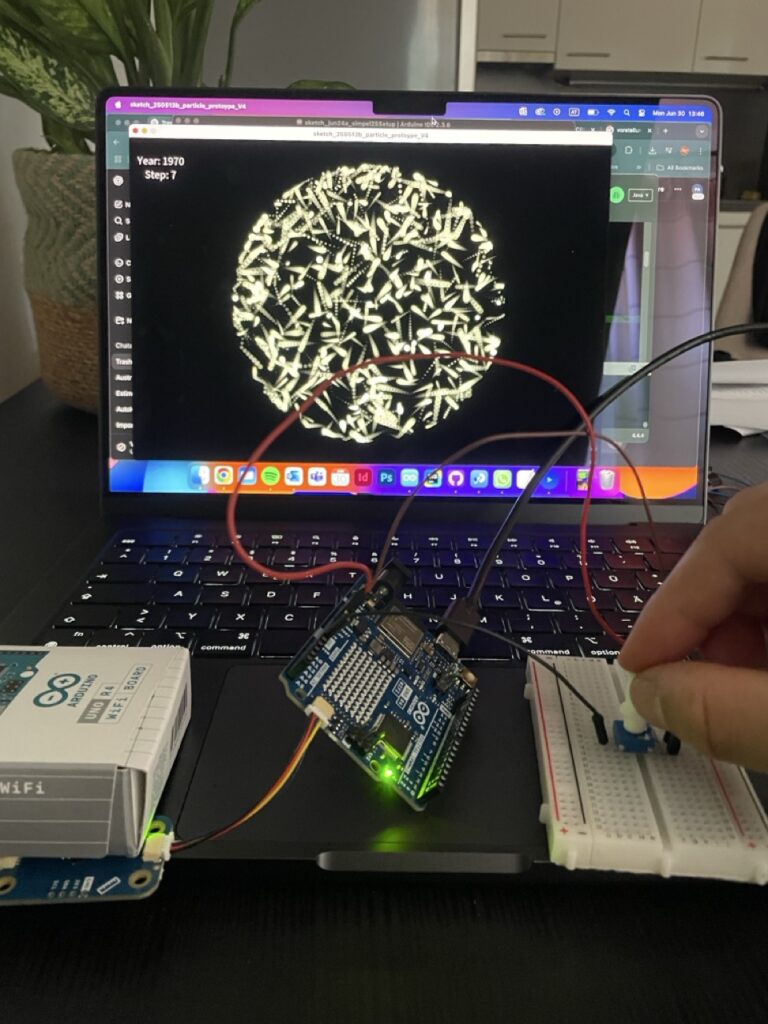
VR as a Special Design Challenge

Virtual reality development highlights the importance of this approach. In VR environments, issues such as motion sickness, spatial confusion, and physical fatigue can occur if design choices are not aligned with human perception and comfort. Prototypes are therefore tested early, often using basic shapes or limited interaction, to observe how players move, react, and navigate. These observations allow developers to refine interactions before expanding the experience. The overall purpose of these processes is to ensure that the final product functions as intended when experienced by diverse players. Testing with real users helps identify challenges that may not be visible to designers or engineers working closely with the system.

Source: https://www.interaction-design.org/literature/article/how-to-understand-user-needs-in-virtual-reality?srsltid=AfmBOopOKeH_8sjLighvBVX2mjNCNtP7S0dj0D1mwOKBO1bDZp9lVcOC

UX Quality in Video Games

As I learned more about UX design and testing, I began to view video games very differently. Instead of only enjoying them as a player, I now pay close attention to how mechanics are introduced, how controls feel, and how smoothly the experience guides me from one action to the next. I’ve noticed how a well-designed game teaches its systems without overwhelming the player, while a poorly designed one creates confusion or frustration through unclear feedback or awkward navigation. My own play experiences have become a source of learning — I can sense when a game’s UX supports my immersion, and equally when it breaks it. Understanding the development behind these decisions has made me appreciate how much careful thought goes into balancing challenge, flow, and usability. Games have essentially become case studies, helping me recognize what makes an interaction feel right, and inspiring ideas for how those same UX principles can be applied in design work beyond gaming.

Source: https://uxplanet.org/how-video-games-can-develop-your-ux-design-skills-e209368330ac

Impulse #3: Nadieh Bremer, WebExpo 2025

This blogpost will be a reflection inspired by Nadieh Bremers’ WebExpo 2025 talk Creating an effective & beautiful data visualisation from scratch with d3.js. Bremer demonstrates how visual interfaces can be designed to convey information clearly and emotionally. She outlines a design process that begins with understanding the data’s story and ends with polishing details such as visual hierarchy, color, and interaction. Her approach emphasizes that visuals should not only communicate facts but also evoke engagement and a sense of discovery. I rewatched the digital documentation of her talk to recap the content of her presentation.

Bremer presents visualization as a communication medium, where design choices directly impact user comprehension and emotional experience. Clarity reduces frustration, while appealing design increases motivation to explore. This perspective positions data visualization as a critical component of user experience, not merely a decorative or aesthetic layer.

Learning about new technologies for data visualization

When I encountered Nadieh Bremers work, I was already familiar with data visualization, but mostly through print media and a little experience with Processing. Designing layouts for magazines or static posters taught me how much data visuals can influence perception and guide a narrative. Around that time we went to WebExpo, I got into JS coding but wasn’t aware of the posibilities to use it for data visualization. Her projects demonstrated what I had been missing in print -> interactivity and adaptivity.

Why adaptive data visualization matters for a good user experience

During my deeper dive into adaptive data visualization literature, I explored a research paper focusing on real-time decision support in complex systems. It argues that static dashboards are no longer enough to support organizations facing rapidly changing data environments. Instead, visualizations must adapt to:

  • Incoming data streams
  • User interactions
  • Context shifts
  • Multivariate complexity

Adaptive systems combine machine learning, real-time processing, and flexible visualization layers to support faster and more informed decision-making. This means that the visualization is not just displaying data, it is interpreting and reacting to it. The paper specifically highlights D3.js as one of the technologies capable of creating these highly flexible and dynamic interfaces. Unlike pre-built dashboards, D3 allows developers to adapt interactions, transitions, and representations directly to user needs and situational changes.

In my earlier blog posts I wrote about affective computing. Combining the gained knowled I came to a conclusion: If a system can visually adapt based not only on the dataset, but also on the emotional state of the user, could generate a better user experience?

Sources:

https://slideslive.com/39043157/creating-an-effective-beautiful-data-visualisation-from-scratch

https://www.researchgate.net/publication/387471439_ADAPTIVE_DATA_VISUALIZATION_TECHNIQUES_FOR_REAL-TIME_DECISION_SUPPORT_IN_COMPLEX_SYSTEMS

Impulse #2: Computer Vision in UI/UX

After diving into Picard’s vision of emotionally intelligent systems, I now found a more technical and practical perspective on how computer vision is already reshaping UI testing. The research paper Computer Vision for UI Testing: Leveraging Image Recognition and AI to Validate Elements and Layouts explores automated detection of UI problems using image recognition techniques, something highly relevant for improving UX/UI workflows today.

Img: Unveiling the Impat of Computer Vision on UI Testing. Pathak, Kapoor

Using Computer Vision to validate Visual UI Quality

The authors explain that traditional UI testing still relies heavily on manual inspection or DOM-based element identification, which can be slow, brittle and prone to human error. In contrast, computer vision can directly analyze rendered screens: detecting missing buttons, misaligned text, broken layouts, or unwanted shifts across different devices and screen sizes. This makes visual testing more reliable and scalable, especially for modern responsive interfaces where designs constantly change during development.

One key contribution from the paper is the use of deep learning models such as YOLO, Faster R-CNN, and MobileNet SSD for object detection of UI elements. These models not only recognize what is displayed on the screen but verify whether the UI looks as intended, something code-based tools often miss when designs shift or UI elements become temporarily hidden under overlays. By incorporating techniques like OCR for text validation and structural similarity (SSIM) for layout comparison, the testing process becomes more precise in catching subtle visual inconsistencies that affect the user experience.

Conclusion

This opens a potential master thesis direction where computer vision not only checks whether UI elements are visually correct but also evaluates user affect during interaction, identifying frustration, confusion, or cognitive overload as measurable usability friction. Such a thesis could bridge technical UI defect detection with affective UX evaluation, moving beyond “does the UI render correctly?” toward “does the UI emotionally support its users?”. By combining emotion recognition models with CV-based layout analysis, you could develop an adaptive UX testing system that highlights not only where usability issues occur but also why they matter to the user.

Source: https://www.techrxiv.org/users/898550/articles/1282199-computer-vision-for-ui-testing-leveraging-image-recognition-and-ai-to-validate-elements-and-layouts

Impulse #1: Affective Computing, Rosalind W. Picard

The work Affective Computing by Rosalind W. Picard from the year 2000 proposes a fundamental paradigm shift in computer science, challenging the traditional view that intelligent machines must operate only on logic and rationality. Picard’s work provides a comprehensive framework for the design of computational systems that relate to, arise from, or influence human emotions.

In Interaction Design we want interfaces that are easy to use and look good. We spend our time while working on projects thinking about usability, efficiency and aesthetics. For us in design, this means a functional interface isn’t enough anymore. If a system doesn’t register that a user is confused or frustrated, it’s not truly successful. Picard essentially launched a new field dedicated to building technology that can sense, interpret, and respond to human emotional states.

Adaptive Interfaces enhanced by Computer Vision Systems

A central connection between affective computing and my work in emotion detection for computer vision lies in the development of adaptive user interfaces. Picard emphasizes that computers often ignore users’ frustration or confusion, continuing to operate rigidly without awareness of emotional signals. By equipping systems with the ability to recognize facial expressions, stress indicators, or declining engagement, interfaces can dynamically adjust elements such as difficulty level, information density, feedback style, or interaction pacing. This emotional awareness transforms an interface from a static tool into an intelligent communication partner that responds supportively to users’ needs. In learning environments, for example, a tutor system could detect when a student becomes overwhelmed and automatically provide hints or slow down the content. In safety-critical settings, such as driver monitoring, emotion recognition can alert systems when attention or alertness drops. Thus, integrating affect recognition directly contributes to more human-centered, flexible, and effective interfaces, aligning with Picard’s vision of computers that interact with intelligence and sensitivity toward humans.

Computer Vision in UX-Testing

Computer vision–based emotion recognition can significantly enhance UX testing by providing objective insights into users’ emotional responses during interaction. Rather than relying solely on post-task questionnaires or self-reporting, facial expression analysis and behavioral monitoring enable systems to detect in real time when a user experiences frustration, confusion, satisfaction, or engagement. Picard highlights that current computers are affect-blind, unable to notice when users express negative emotions toward the system, and therefore cannot adjust their behavior accordingly. Integrating affective sensing into UX evaluation allows designers to pinpoint problematic interface moments, identify cognitive overload, and validate usability improvements based on measurable affective reactions.

In summary, the intersection of affective computing, computer vision, and adaptive interfaces offers a protential research path for my master thesis. By enabling systems to detect emotional reactions through facial expressions and behavioral cues, UX testing can become more insightful and responsive, leading to interface designs that better support the users needs. Building on Picard’s foundational ideas of emotional intelligence in computing, my research could contribute to developing affect-aware evaluation tools that automatically identify usability breakdowns and adapt interactions in real time.

Evaluating a Master Thesis: Ender Özerdem

Ender Özerdem’s 2012 master’s thesis, Evaluating the Suitability of Web 2.0 Technologies for Online Atlas Access Interfaces, explores how participatory web features such as recommendations, user comments, and blogs can enhance online atlas usability. Through a prototype simulating an Austrian online atlas and usability testing with 30 participants, the study empirically assesses user reactions to these interactive elements. The results show that Web 2.0 functions can meaningfully improve user engagement and navigation, demonstrating both practical innovation and sound methodological execution.

Overview

Author: Ender Özerdem
Title: Evaluating the Suitability of Web 2.0 Technologies for Online Atlas Access Interfaces
Institution: Vienna University of Technology, Institute of Geoinformation and Cartography
Supervisors: Univ.-Prof. Dr. Georg Gartner; Dipl.-Ing. Felix Ortag
Year: 2012
Length: ~80 pages + appendices
Artifact: an interactive prototype of an online atlas of Austria (implemented as a clickable PDF simulating web interfaces) used for usability testing with 30 participants.

Structure:

  1. Introduction
  2. Basics
  3. Map access methods
  4. Web 2.0
  5. Empirical evaluation
  6. Results
  7. Conclusions

Evaluation

Overall Presentation Quality

The thesis is well-formatted and consistently structured, following scientific conventions. Figures, tables, and lists are clear and properly captioned. The bilingual abstract (English + German) is concise and accurately summarizes the aims, methods, and findings. Minor typographical inconsistencies exist but do not impede comprehension. Overall presentation quality is very good.

Degree of Innovation

The work tackles the novel (for 2012) question of how Web 2.0 interactivity—recommendations, comments, tag clouds, blogs, RSS—might enrich online atlases. This was a forward-looking intersection between cartography and web usability. The idea of combining usability testing with interactive atlas prototypes represents a meaningful contribution, though not groundbreaking at a theoretical level. The innovation lies primarily in applied integration of Web 2.0 principles into geographic interfaces.

Independence

Özerdem designed and executed the empirical evaluation, built the prototype interface, and conducted the usability tests autonomously. The methodological and implementation details indicate independent planning and execution under supervision. The inclusion of custom interface variants and a participant survey supports this.

Organization and Structure

The work is logically organized. Each chapter builds upon the previous: theoretical groundwork → analysis of existing systems → introduction of new technologies → empirical test → interpretation. The flow from problem statement to results is coherent. However, minor redundancies appear in the literature review (e.g., extended quotations from definitions).

Communication

The writing style is formal, clear, and mostly fluent. Definitions and literature are carefully integrated, though sentence structure occasionally reflects non-native phrasing. Visual materials (figures and screenshots) effectively support comprehension. Technical terminology is correctly used throughout.

Scope

The chosen topic, evaluating Web 2.0 features within online atlas interfaces, is handled with appropriate breadth and depth for a master’s level. The work balances theoretical exposition and empirical application effectively. The 70+ page length is proportional to the scope.

Accuracy and Attention to Detail

The text demonstrates careful referencing and accurate terminology in cartography and web technology. Tables and figures are labeled consistently. Only minor formatting inconsistencies (e.g., spacing, capitalization) occur. The methodology is described in enough detail to be replicable.

Literature

The literature review is broad and relevant, covering both classic cartographic sources (Bollmann & Koch; Kraak & Ormeling) and Web 2.0 theory (O’Reilly, 2005; Gartner, 2009). While comprehensive for its time, it lacks more recent (post-2010) empirical studies on user-generated mapping—an understandable limitation given the publication date. Citation style is consistent.

The Prototype

The prototype developed by Ender Özerdem effectively demonstrates the integration of Web 2.0 features, such as recommendations, user comments, and tag clouds, into an online atlas interface. Although implemented as a clickable PDF rather than a live web application, it is clearly structured, visually coherent, and sufficiently interactive for usability testing. The documentation provides detailed explanations of interface variants, user tasks, and testing procedures, ensuring transparency and reproducibility. Overall, the prototype successfully translates the thesis’s theoretical ideas into a practical, testable form and meets the expected standards of a master’s-level artifact.

Conclusion

In conclusion, Ender Özerdem’s Evaluating the Suitability of Web 2.0 Technologies for Online Atlas Access Interfaces (2012) is a well-structured and methodically robust thesis that effectively combines theoretical research with empirical testing. Despite the prototype’s limited technical scope and a modest sample size, the work shows strong independence, clear documentation, and valuable insights into enhancing online atlas interfaces through participatory web features. Overall, it demonstrates solid academic competence and practical innovation, meriting a ~2, 2+ evaluation.

Powered by ChatGPT

#6 Final Prototype and Video

Have fun with this Video to find out what my actual Prototype is.

Reflection

This project began with a vague idea to visualize CO₂ emissions — and slowly took shape through cables, sensors, and a healthy amount of trial and error. Using a potentiometer and a proximity sensor, I built a simple system to scroll through time and trigger animated data based on presence. The inspiration came from NFC tags and a wizard VR game (yes, really), both built on the idea of placing something physical to trigger something digital. That concept stuck with me and led to this interactive desk setup. I refined the visuals, made the particles feel more alive. I really want to point out how important it is to ideate and keep testing your ideas, because there will always be changes in your plans or something won’t work etc. Let’s go on summer vacation now 😎

#5 Vizualisation Refinement and Hardware Setup

Over the past few weeks, this project slowly evolved into something that brings together a lot of different inspirations—some intentional, some accidental. Looking back, it really started during the VR project we worked on at the beginning of the design week. We were thinking about implementing NFC tags, and there was something fascinating about the idea that just placing an object somewhere could trigger an action. That kind of physical interaction stuck with me.

NFC Tag

Around the same time, we got a VR headset to develop and test our game. While browsing games, I ended up playing this wizard game—and one small detail in it fascinated me. You could lay magical cards onto a rune-like platform, and depending on the card, different things would happen. It reminded me exactly of those NFC interactions in the real world. It was playful, physical, and smart. That moment clicked for me, I really like the idea that placing something down could unlock or reveal something.

Wizard Game

Closing the Circle

That’s the energy I want to carry forward into the final version of this project. I’m imagining an interactive desk where you can place cards representing different countries and instantly see their CO2 emission data visualized. For this prototype, I’m keeping it simple and focused—Austria only, using the dataset I already processed. But this vision could easily scale: more countries, more visual styles, more ways to explore and compare. Alongside developing the interaction concept, I also took time to refine the visualization itself. In earlier versions, the particle behavior and data mapping were more abstract and experimental—interesting, but sometimes a bit chaotic. For this version, I wanted it to be more clear and readable without losing that expressive quality. I adjusted the look of the CO2 particles to feel more alive and organic, giving them color variation, slight flickering, and softer movement. These small changes helped shift the visual language from a data sketch to something that feels more atmospheric and intentional. It’s still messy in a good way, but now it communicates more directly what’s at stake.

Image Reference

Image 1 (NFC Tag): https://www.als-uk.com/news-and-blog/the-future-of-nfc-tags/

Image 2 (Wizard Game): https://www.roadtovr.com/the-wizards-spellcasting-vr-combat-game-early-access-launch-trailer-release-date/

#4 Alright… Now What?

So far, I’ve soldered things together (mentally, not literally), tested sensors, debugged serial communication, and got Arduino and Processing talking to each other. That in itself feels like a win. But now comes the real work: What do I actually do with this setup?

At this stage, I started combining the two main inputs—the proximity sensor and the potentiometer into a single, working system. The potentiometer became a kind of manual timeline scrubber, letting me move through 13 steps that represent a line, which should be a test for a potential timeline? The proximity sensor added a sense of presence, acting like a trigger that wakes the system up when someone approaches. Together, they formed a simple but functional prototype of a prototype, a rough sketch of the interaction I’m aiming for. It helped me think through how the data might be explored, not just visually, but physically, with gestures and motion. This phase was more about testing interaction metaphors than polishing visuals—trying to understand how something as abstract as historical emissions can be felt through everyday components like a knob and a distance sensor. This task pointed out to me, how important testing and the ideation of your ideas can be, to get a better understanding of your own thoughts and to form a more precise imagination of your plan.

Small Prototype to connect sensors in one file

Things about to get serious

Building on the knowledge I gained during the ideation phase, I connected my working sensor system, a potentiometer and proximity sensor to the Processing sketch I had developed during design week. That earlier version already included interaction through Makey Makey and homemade aluminum foil buttons, which made for a playful and tactile experience. In my opinion, the transfer to Arduino technology made the whole setup easier to handle and much cleaner—fewer cables, more direct control, and better integration with the Processing environment. The potentiometer now controls the timeline of Austria’s CO2 emissions, while the proximity sensor acts as a simple trigger to activate the visualization. This transition from foil to microcontroller reflects how the project evolved from rough experimentation into a more stable, cohesive prototype.

#3 Serial Communication Between Arduino and Processing

By this point, I had some sensors hooked up and was starting to imagine how my prototype might interact with Processing. But getting data from the physical world into my visuals? That’s where serial communication came in! On the Arduino side, I used “Serial.begin(9600)” to start the connection, and “Serial.println()” to send sensor values. In my case, it was messages like “true” when a hand moved close to the distance sensor, and “false” when it moved away. On the Processing side, I used the Serial library to open the port and listen for data. Every time a new message came in, I could check if it was “true” or “false”, and change what was being shown on screen — red background, green background, whatever. So I was prototyping the prototype, you could say.

Why this is so fascinating and helpful 🤯

I wanted to build something quick, easy to use and reactive—and serial communication made it possible to prototype fast without diving into WiFi, Bluetooth, or custom protocols. It lets me test ideas in minutes: turn a knob, wave a hand, watch the screen respond. And for something as conceptual and messy as visualizing CO2 history with simple and fast coding, that immediacy is everything.

Imagine you’re at an interactive museum exhibit about climate change. As a visitor approaches a screen, a hidden distance sensor detects their presence. The Arduino sends “true” to Processing, which triggers a cinematic fade-in of historical CO2 data and a narration starts playing. When the visitor steps away, the system fades back into a passive state, waiting for the next interaction. That whole experience? Driven by serial communication. One cable. A few lines of code. Huge impact.

Some helpful links for those who are interested in serial communication:

https://learn.sparkfun.com/tutorials/connecting-arduino-to-processing/all

#2 First Steps with Arduino

So my initial project about the CO2 emissions in AUT had 13 steps on a timeline you could loop through with key controls. So I’m thinking how am I gonna set my Arduino parts up, to work with my existing concept? This blogpost should tell you about my first steps, trying to figure that out. Connecting the parts—trying to get progress towards the concept of my existing one.

My thoughts creating this code were pretty loose at first. I just wanted to get some kind of input from the potentiometer, without fully knowing what I’d do with it yet. I had the concept of a CO2 visualization in the back of my mind, and I knew I had split the data into 13 time periods earlier, so I figured I’d map the potentiometer to 13 steps and see what happens. It was more about testing how I could interact with the data physically, using whatever tools I had lying around. The code itself is super basic—it just checks if the current step has changed and then sends that info over serial. It felt like a small but useful first step.

Also i integrated a distance modulino already thinking about how i could use this one for my prototype.

With a very basic setup from the library, to get the input of the sensor. I wrote a sketch that just triggers true or false when i move my hand over the sensor. I am thinking about my very first idea of the design week, to trigger an interaction/visualisation when i step on a plate with the shape of the country I want to see the emission data of. Maybe I can go in this direction this time? I want to give you another picture to show you what I mean.

Of course, this will not be realizable now but thinking about the map interaction could be a good concept for the technological boundaries I have set with my pieces I got from the FH.