Below are the four participants whose heart-rate-variability traces we have explored.
We deliberately chose them because they sit at clearly different points on the “health–illness” spectrum and therefore give us a compact but vivid physiological palette.

- Subject 119 is our practical baseline. No cardiac findings, no anxiety-or-depression scores, no PTSD, no “Type-D” personality pattern. Anything we hear or see in this person’s HRV should approximate the dynamics of an uncomplicated, resilient autonomic system.
- Subject 091 represents a “mind-only” disturbance. The heart itself is structurally sound, but the person carries the so-called Type-D trait (high negative affect, high social inhibition). This makes the autonomic system more reactive to worry or rumination even when the coronary vessels are normal.
- Subject 044 adds psychological trauma on top of mild, non-obstructive angina. Clinically this participant scores high on anxiety and meets full PTSD criteria. We therefore expect brisk sympathetic surges, slower vagal recovery and more noise in the LF/HF ratio—an autonomic pattern often seen in hyper-arousal states.
- Subject 005 is the most medically burdened case: non-obstructive angina, endothelial dysfunction, stress-induced ischaemia, plus anxiety, depression, Type-D personality and PTSD. In short, both the mechanical pump and the emotional “software” are under strain, so variability measures are likely compressed and heart-rate plateaus may appear where a healthy person would fluctuate.
Using these four contrasting bodies as our “voices” lets us investigate how the same 6-min rest → 12-min exercise → 6-min recovery protocol is translated into four distinct autonomic narratives—information we will later map into equally distinct sonic textures.
HR
In general, each cardiovascular system answers physical load differently, depending on the baseline autonomic tone, fitness, psychological state, and comorbidities.
sub 115 – “healthy”
The heart “ramps up” slowly. Pulse climbs in stair-like steps with brief dips between peaks—the body is constantly trying to regain homeostasis. After the exercise HR quickly falls almost to baseline. This is typical of a well-trained, adaptive cardiovascular system with a large functional reserve.

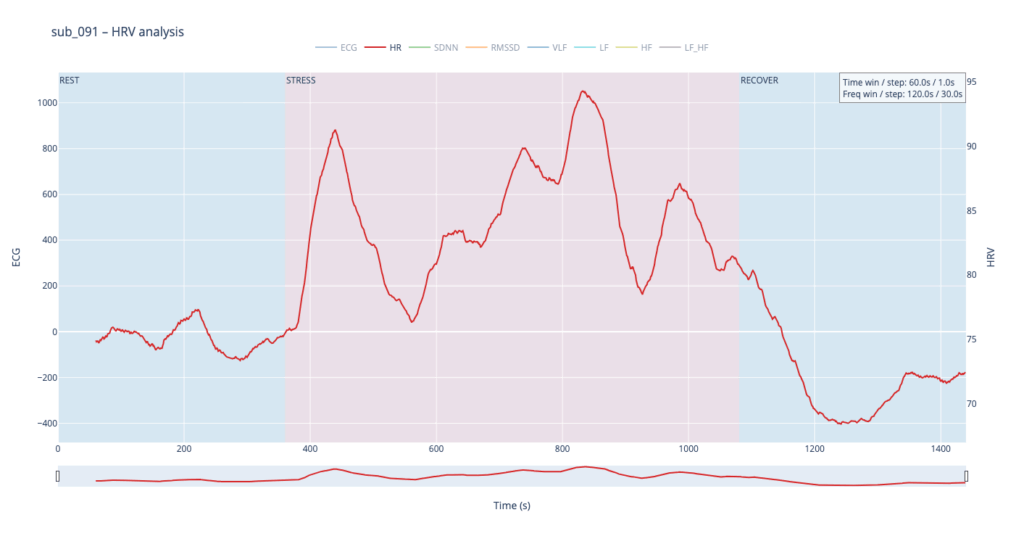
sub 091 – “mental / Type D”
Resting HR is slightly above normal, yet overt anxiety is absent. The response is inertial: about a minute after load starts HR jumps from 75 → 91 bpm, then plummets to 76, followed by alternating short rises and falls. When the exercise stops, HR drops to 68 (below the initial value) and only then drifts back to ~75. Such a “swing” may reflect conflicting sympathetic vs. parasympathetic signals: outward calm while inner tension builds and discharges in bursts.
sub 044 – “PTSD”
Even before load the heart is already in “fight-or-flight” mode (~83 bpm). The onset of exercise changes little, but at the third minute HR spikes to 98. It then declines stepwise yet remains high (89–97) even during recovery. The absence of a deep post-exercise dip shows that the parasympathetic “brake” hardly engages— the body struggles to shift into a resting state.

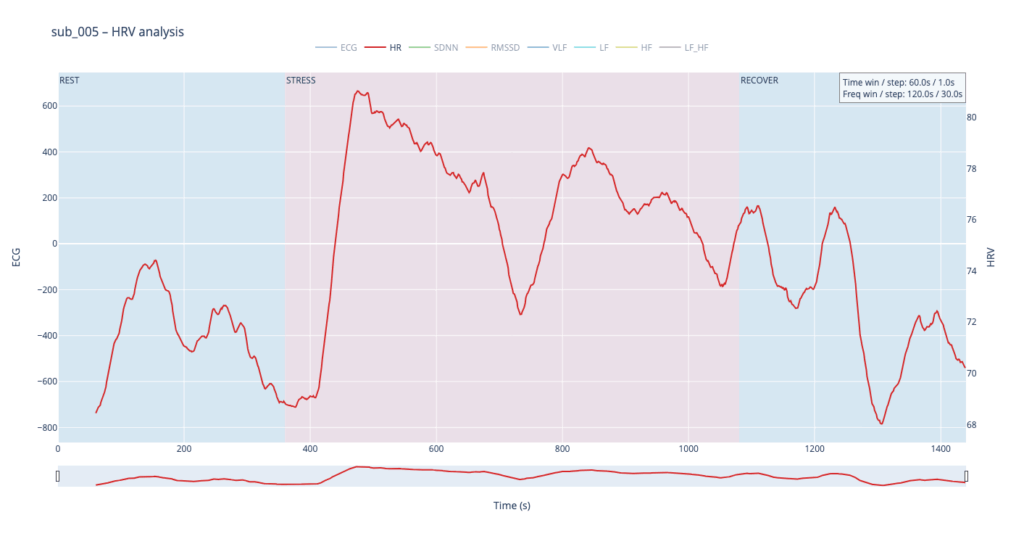
sub 005 – “sick / multiple pathologies”
Baseline HR is 68. At the start of exercise it leaps to 80, after which it very slowly, step-by-step, drifts back toward normal and stays there until the end of the trial. The pattern resembles sub 044 but with lower background stress and slightly better recovery.
In healthy subjects the heart rate rises smoothly in step-like waves during effort and quickly settles back to baseline once the task stops, reflecting a well-balanced push-and-pull between sympathetic “accelerator” activity and parasympathetic (vagal) “brakes.” In patients with cardiac disease, PTSD or Type-D traits the resting rate is already elevated, the response to stress is sharper or more erratic, and the return to baseline is sluggish, showing a system locked in chronic “fight-or-flight” with weaker vagal damping.
Sound-design mapping:
Based on HR, I want to create drum patterns, where the lowest HR generates only kick, and then if HR rises, we can add more percusive elements.
SDNN
SDNN tracks how much the RR-intervals expand and shrink over time.
- When the value climbs, the spacing between beats becomes more irregular—your heart is “dancing” around the mean to satisfy moment-to-moment demands.
- When the value sinks, the intervals line up almost like a metronome—either the organism is in very deep rest or the rhythm is held in a tight sympathetic “clamp” and cannot flex.
- Usually this parameter is calculated for 24 hours, but since we dont have such luxury, we stick to 2min time window

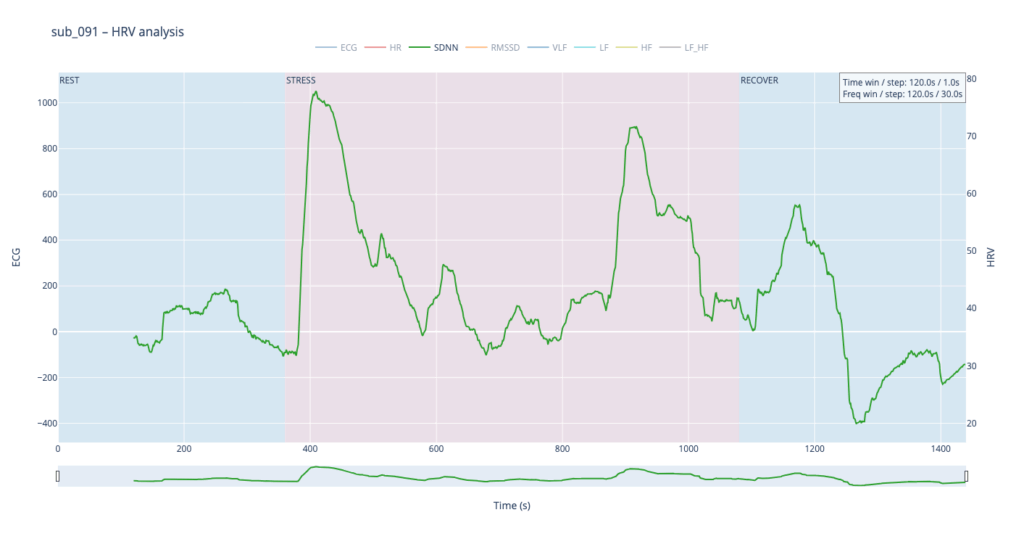
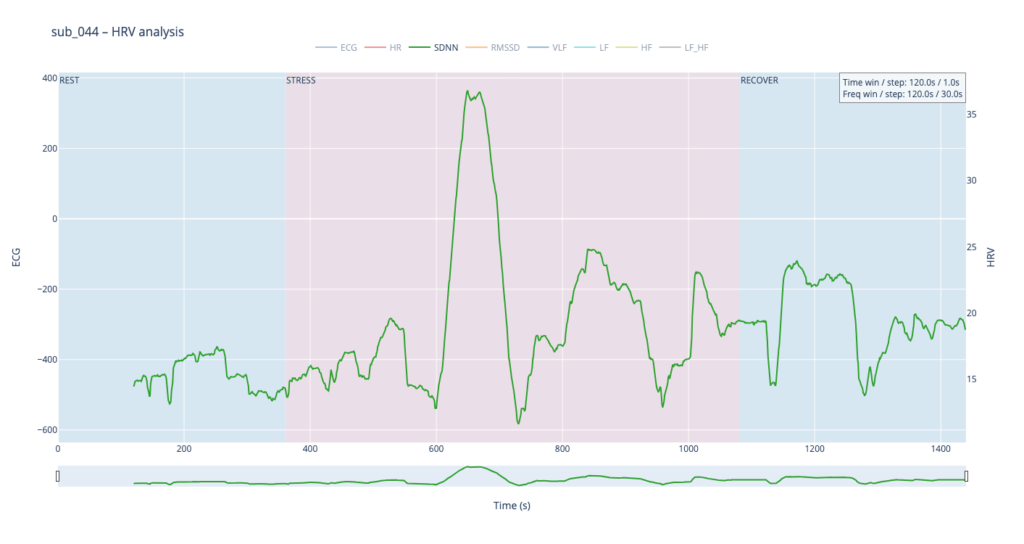

Looking at all four traces, the healthy control shows the widest SDNN swing and more frequent surges during the load phase. This wide dynamic range tells us the cardiac pacemaker is quick to loosen and tighten the rhythm, i.e. it adapts smoothly to the body’s changing needs. By contrast, the clinical subjects operate in a narrower corridor: their SDNN rarely strays far from baseline, signalling that the heart either remains compressed by chronic sympathetic tone or cannot recruit enough parasympathetic “slack” to respond fully.
For the sound-mapping layer, I’d like to add a short delay on the Drums track and control athe mount of feedback and reverb of echoes.
RMSSD
RMSSD is conceptually close to SDNN, but it is calculated as the square root of the mean of the squared differences between successive RR intervals. In essence, RMSSD captures beat-to-beat (“breath-by-breath”) variability, whereas SDNN reflects overall dispersion of intervals within the chosen window. Because of this local focus, we processed RMSSD in a shorter analysis window—30 seconds with a 10-second step—to obtain a curve that is smooth yet sensitive to rapid changes.


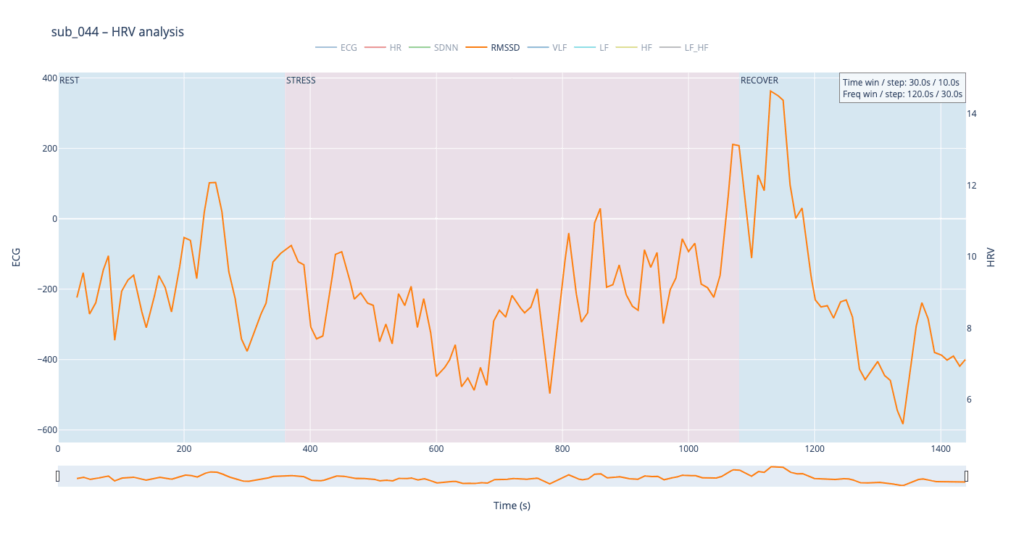
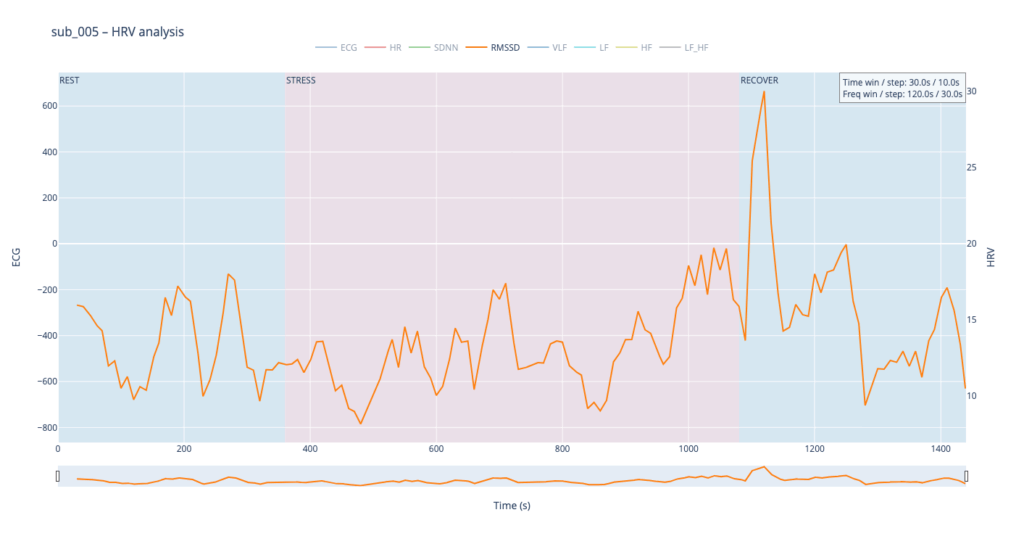
The comparative analysis reveals patterns similar to SDNN, with several noteworthy differences. First, in the clinical subjects, the RMSSD range is almost twice as narrow, indicating reduced high-frequency variability—the heart is working in a more “rigid” mode. Second, in both pathological cases, RMSSD rises noticeably toward the end of the protocol: once exercise stops, sharp spikes appear that are virtually absent in the healthy subject. This delayed surge suggests a late engagement of parasympathetic control—the body remains under sympathetic drive for a prolonged period and only during recovery tries to compensate, generating erratic, uneven intervals.
To highlight the heart’s “rigidity,” I plan to map RMSSD to the pitch shift of drums.
Spectral HRV analysis
For spectral HRV analysis the gold-standard window is about five minutes, but in this project we need a compromise between scientific reliability and near-real-time responsiveness. We therefore use a 120-second window with a 60-second step.
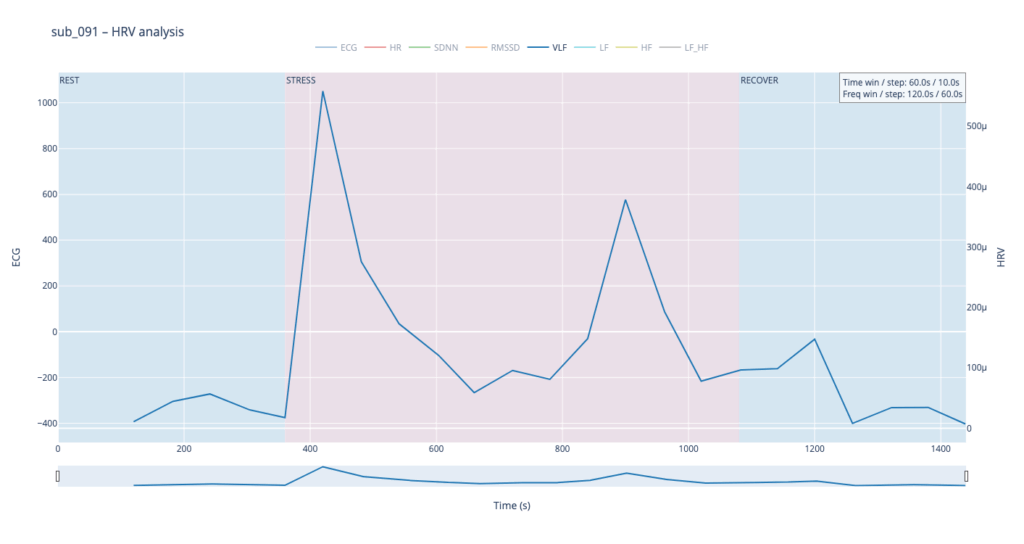
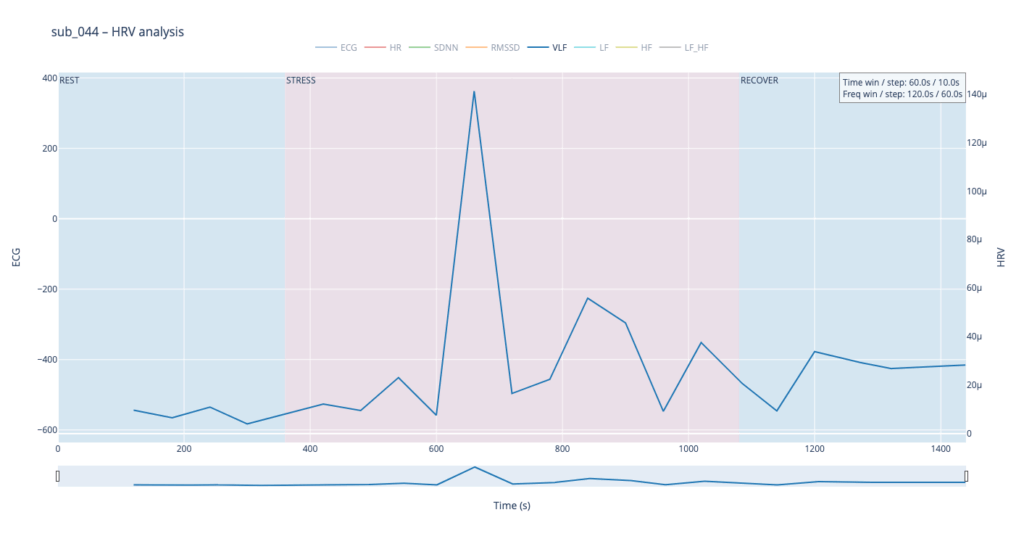
VLF
Within such a short segment, the VLF band (0.003–0.04 Hz)—which is thought to reflect very slow regulatory processes such as hormonal release and thermoregulation—cannot be interpreted with the same statistical confidence as in traditional five-minute blocks. Even so, the plots still reveal that surges in VLF power tend to appear just before rises in heart-rate amplitude. In our context that timing may hint at micro-shifts in core temperature or other slow-acting homeostatic mechanisms that prime the cardiovascular system for the upcoming workload.

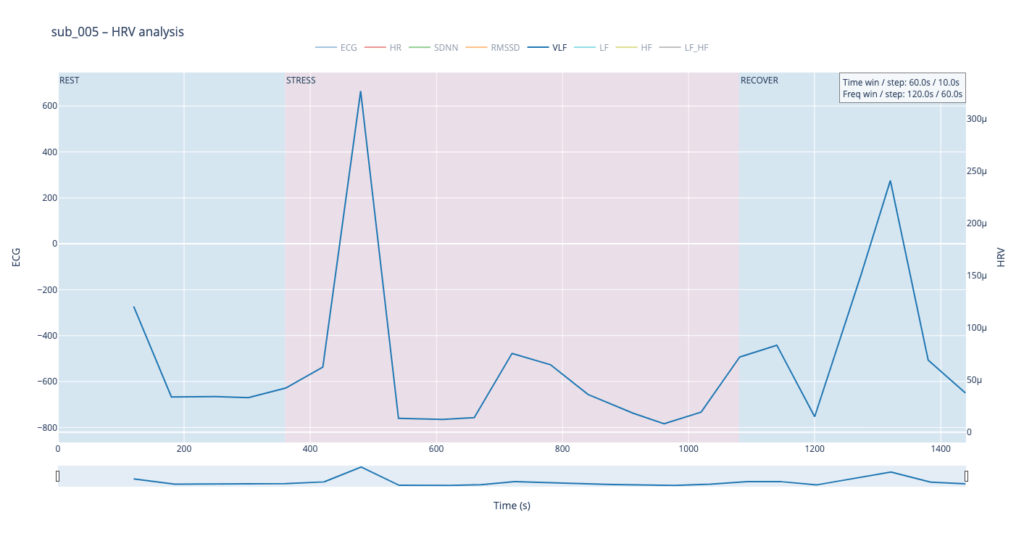
VLF → Sub-bass “body boil” layer
We will map the slow-acting VLF band to a very low sub-bass drone in the first octave (≈ 30-60 Hz). As VLF power rises the pitch of this bass note is gently shifted upward by a few semitones and a subtle vibrato (slow LFO) is added. The result feels like liquid starting to simmer: higher VLF = hotter “water,” faster wobble, and a slightly higher fundamental. A pre-recorded low-frequency sample (e.g., pitched-down kettle rumble) can sit under the main mix; its playback pitch follows the same VLF curve to reinforce the sensation. When VLF falls, both pitch and vibrato relax, letting the bass settle back to its calm, foundational tone. This approach sonically frames VLF as the deep thermal undercurrent of the body.
LF & HF
Low-Frequency (LF, 0.04–0.15 Hz) and High-Frequency (HF, 0.15–0.40 Hz) power curves mirror the behavior we already saw with SDNN and RMSSD. That is perfectly logical: SDNN and LF both track activity of the sympathetic branch, which dominates under stress—heart rate accelerates, blood pressure rises, LF climbs. Conversely, HF and RMSSD follow the parasympathetic (“vagal”) branch: as the body relaxes, the heart slows, breathing deepens, and HF increases.
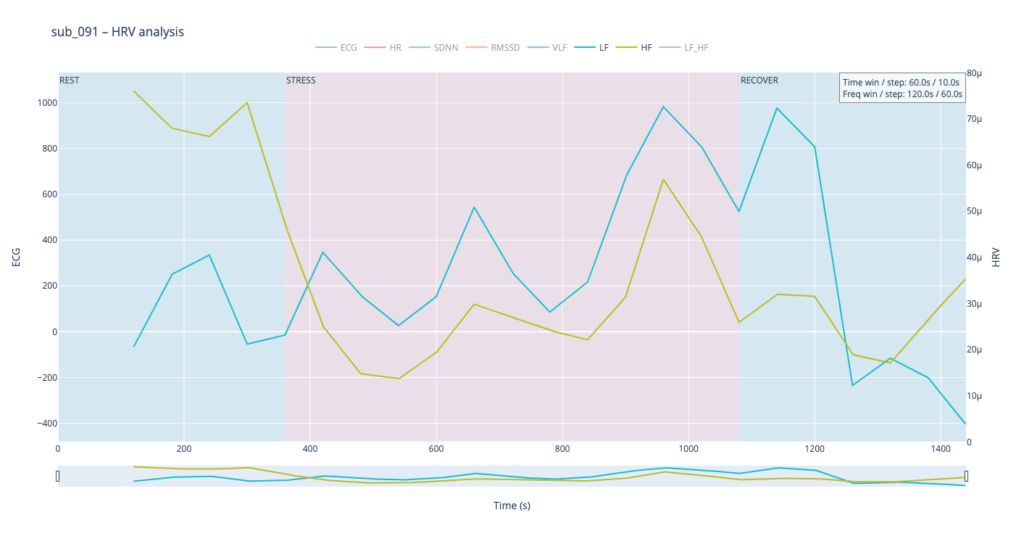
Patient 091 delivers a textbook illustration of that theory. At rest his HF overtops LF, but the moment exercise begins the autonomic balance flips—LF jumps above HF and keeps climbing, whereas HF rises more modestly and then drops back near the end, underscoring how hard it is for his system to settle.
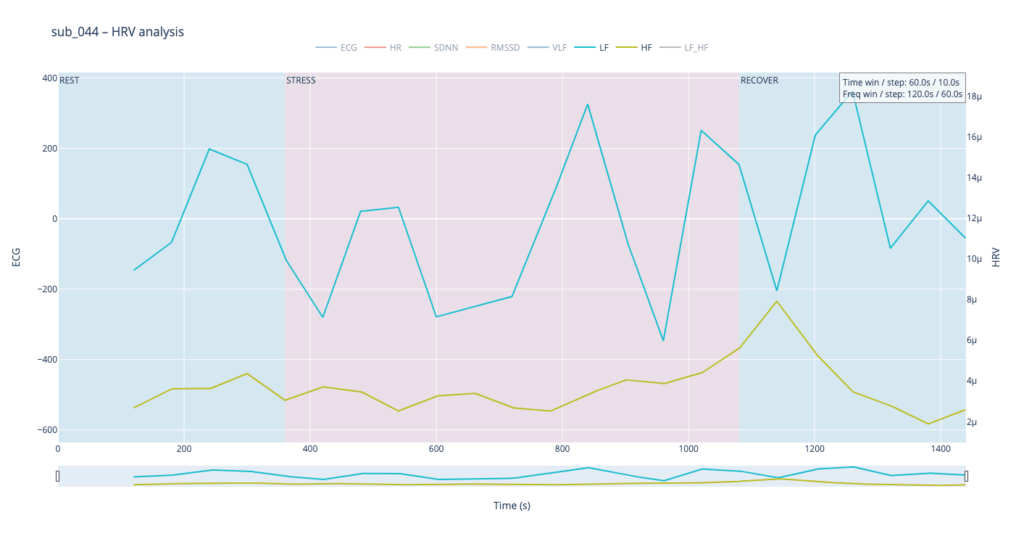
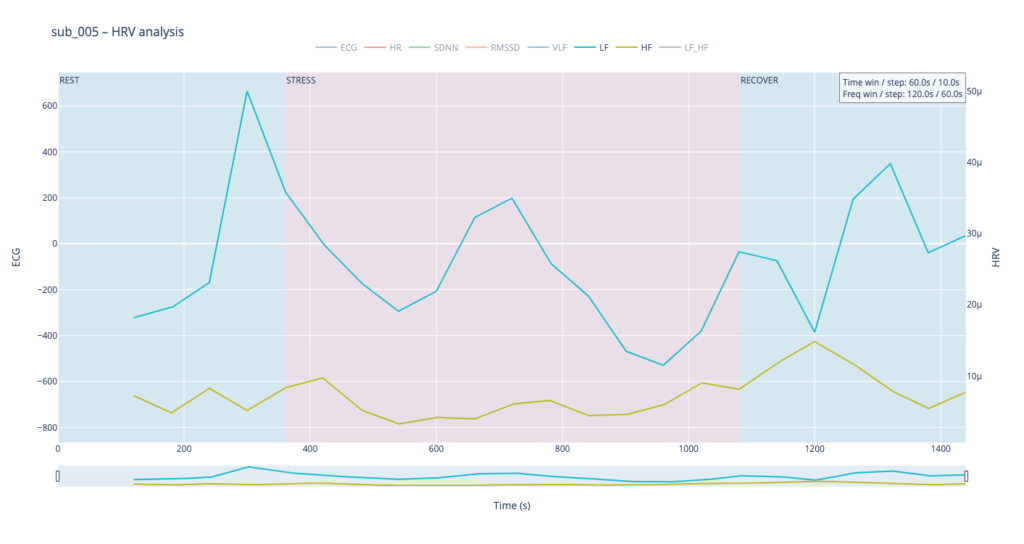
By contrast, our other symptomatic patients (044 and 005) show LF dominating HF throughout, signalling a chronically tense autonomic state.

The healthy subject 115 starts with LF and HF almost equal; as effort mounts the gap widens in a smooth, orderly fashion.
Sonically, LF and HF make a natural complement to the VLF layer. We can map their absolute values to pitch in the second octave while using the LF/HF ratio to shape timbre—blending from a pure sine wave toward an edgier saw-like texture. When LF/HF is below 2, the sound stays near sine (calm, vagal tone); as the ratio exceeds 2, it becomes increasingly “saw-toothed,” evoking sympathetic arousal. Also, with this parameter, I would like to control the music scale from major to minor.
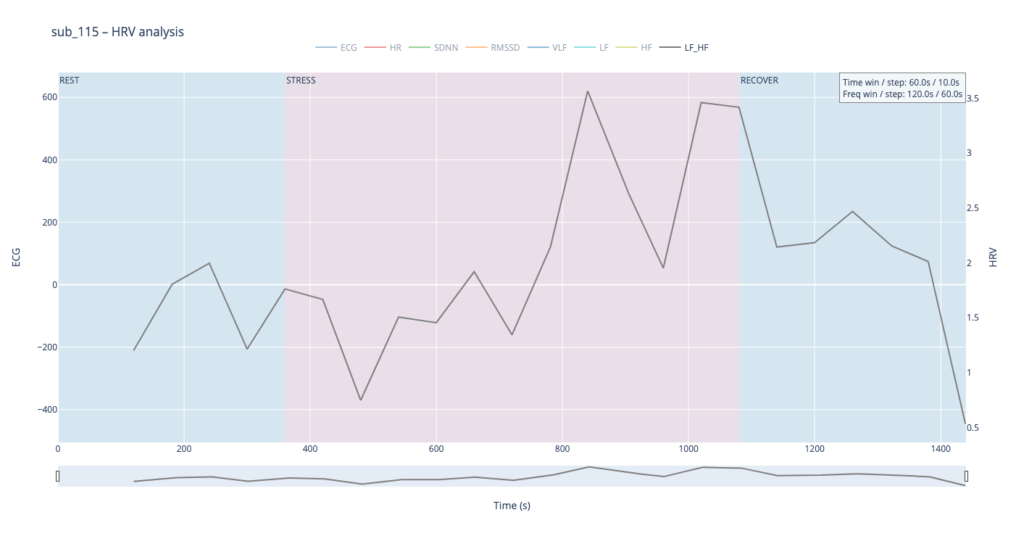
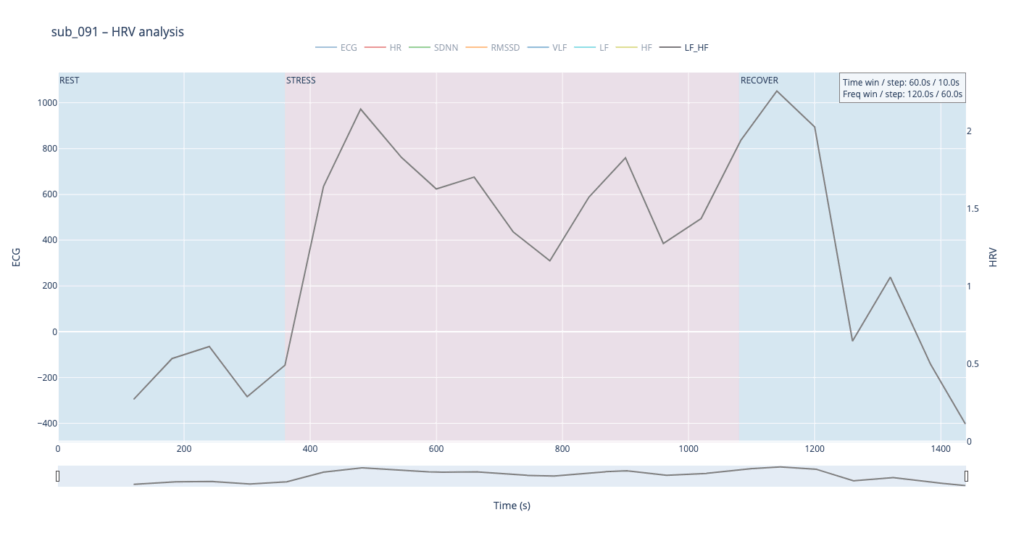
In practice, we see 115 and 091 resting in the neutral range and pushing upward only during exercise—the difference being that 115 ascends gradually, whereas 091 leaps. Both glide back to baseline once the task ends.
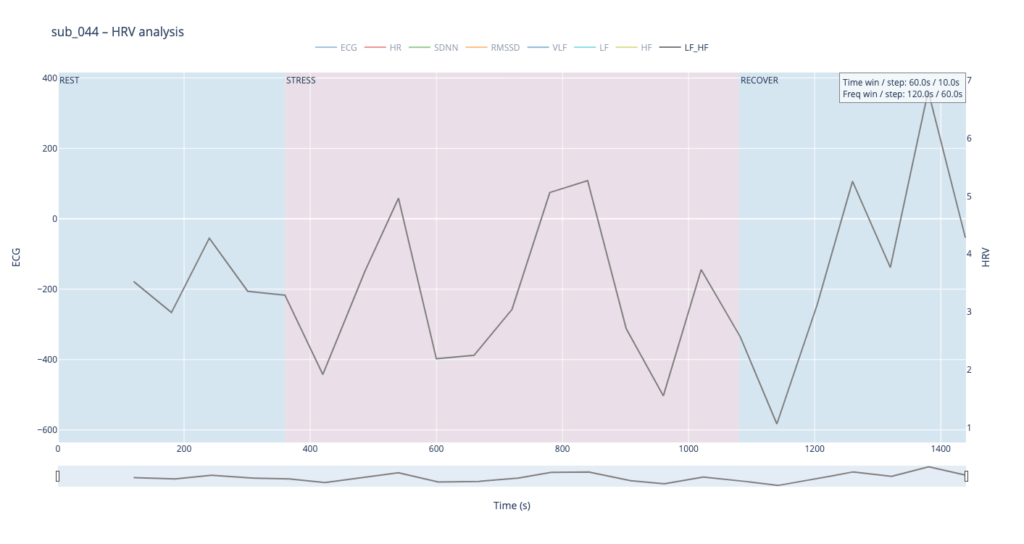
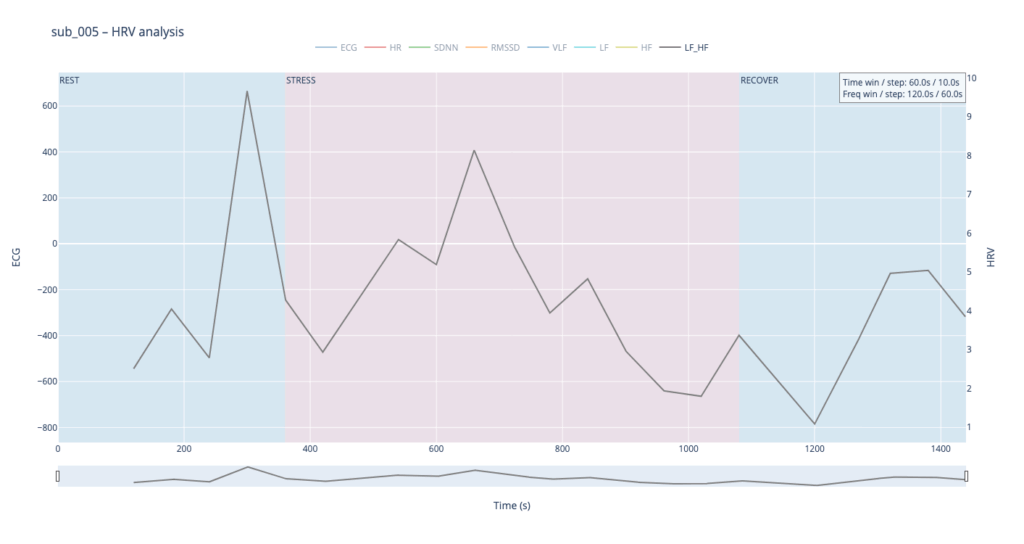
Patients 044 and 005, however, begin with ratios already high and jittering, telegraphing their persistent sympathetic load.
The next stage will be to develop an algorithm that converts these metrics into MIDI messages that can be mapped to parameters inside a DAW, or, alternatively, to build a SuperCollider or Pure Data patch implementing the same control scheme.