#15 Building a pocket sized tactile flood map

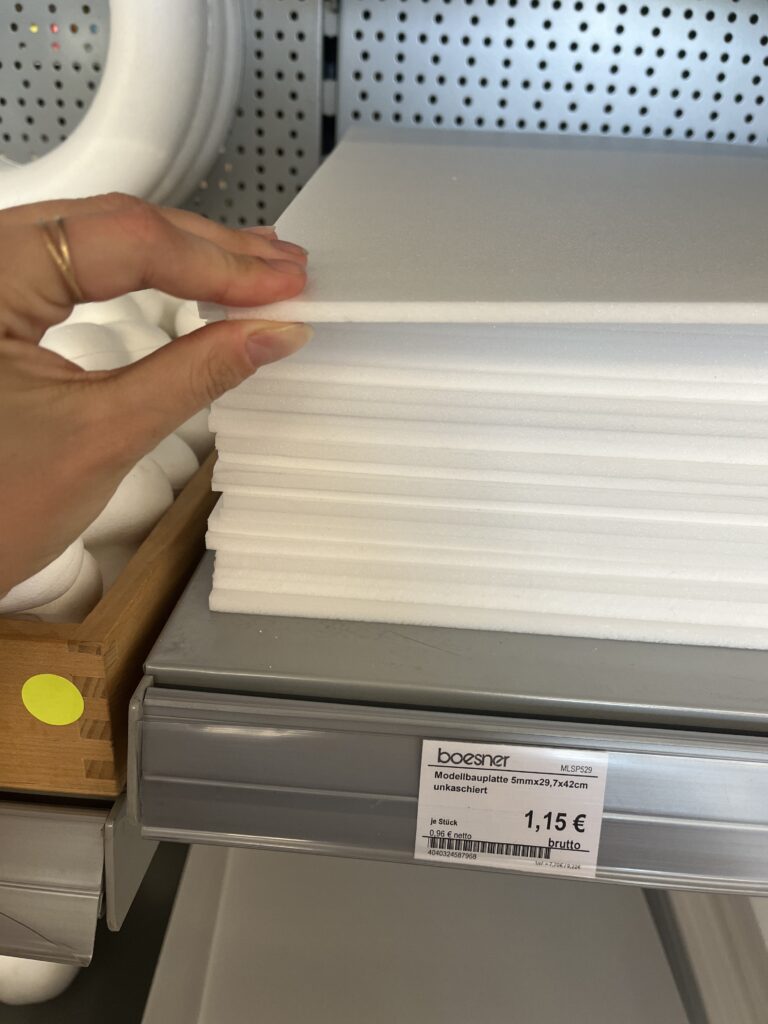
Three cups of coffee, an A4 sheet of foam board, and a stack of scavenged textures later, I finally have a first physical model of flood risk in the Tulln area. It is rough, flimsy in places, and already shedding, but it’s also the most concrete (and tactile!) expression of my idea so far.


Choosing “A4” over “A-Lot”

I promised myself to work small this time. An ~A4 footprint forces ruthless simplification:

  • Only the Danube’s immediate floodplain.
  • No elevation gain because there is almost none in that area.
  • 2 flood scenario (HQ 30 & HQ 100).

That constraint kept the materials list tight and the cutting tolerable with a hobby knife.


Thirty-Minute Build

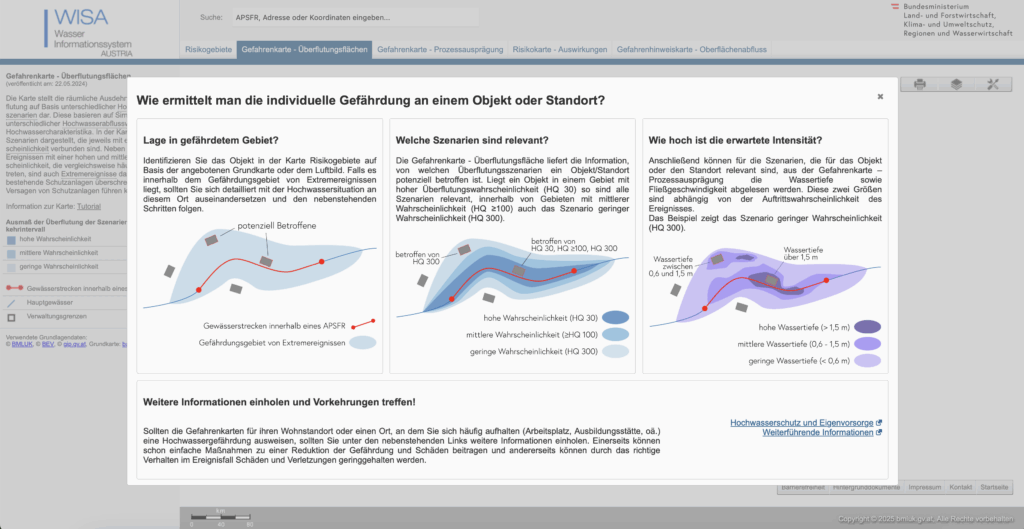
  1. Print → Trace → Cheat Printer died, so I traced the WISA map contours right off my screen onto scrap paper, then onto materials—eyeballing when necessary.
  2. Knife workQuick, approximate cuts of cardboard, cork, felt, and foam.
  3. Base & WaterCraft-foam ribbon for the Danube; its cool, slick surface instantly stands out.
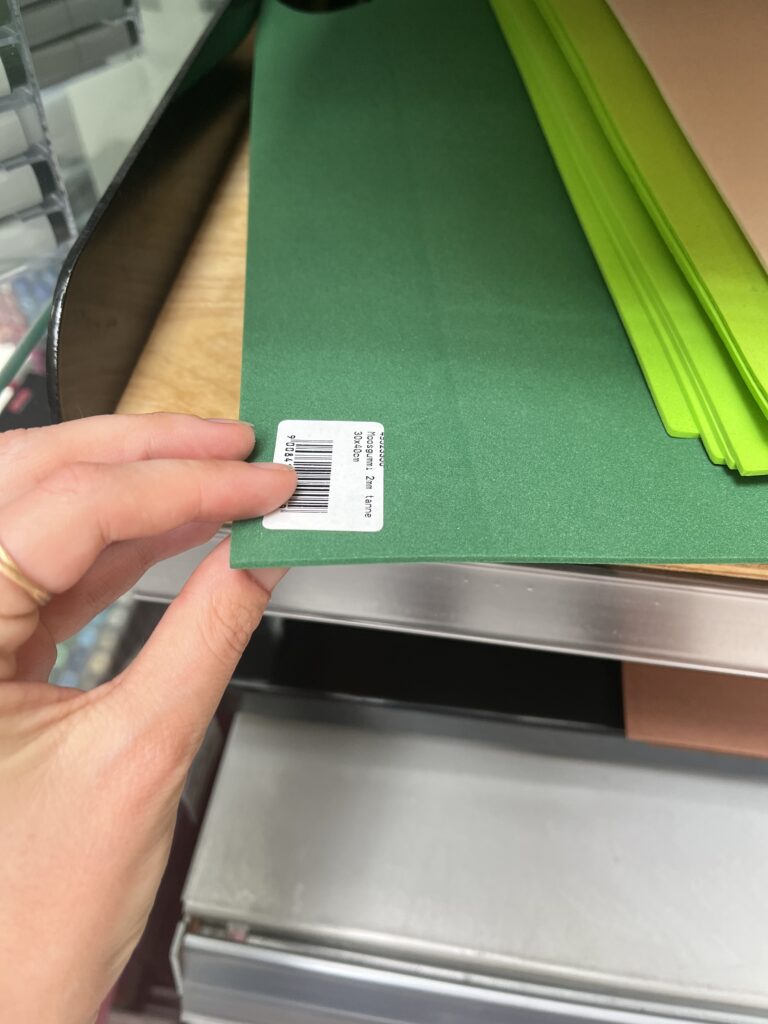
  4. Land UsesFelt for green, cork for sealed areas. Simple rectangles keep the skyline abstract.
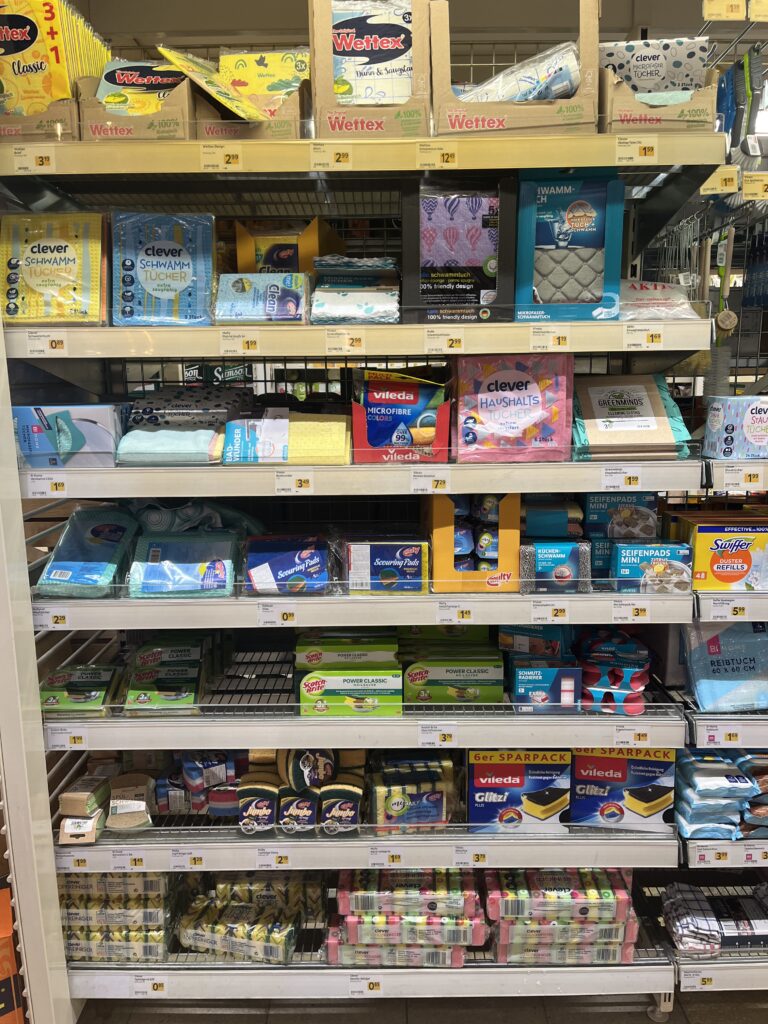
  5. Flood OverlaysRough side of each sponge = HQ 30; soft cellulose side = HQ 100. Cut to match the WISA outlines and glued as over-lays.

Total build time: ~30 minutes.


First Blind Pass

With eyes closed I traced from river outward:

  • Foam river – instantly identifiable.
  • Rough sponge – HQ 30; its grit jolts the fingertip.
  • Soft sponge – HQ 100; squishy, cooler, clearly distinct.
  • Felt – forgiving, farmland vibe.
  • Cork – rigid and grainy; screams “built-up.”
  • Cardboard steps – subtle, but enough curb-height to prove the land does rise.

What I Learned

  • At A4 scale every millimetre matters. Flood zones have to be chunky enough to feel but not so thick they dwarf the elevation logic.
  • Textures communicate hierarchy if the height difference is consistent. Soft-but-low worked only when the sponge sat at the same level as the surrounding terrain.
  • Material memory is powerful. Sandpaper felt “urban” without explanation, reaffirming research on intuitive texture cues.

Further thoughts

  1. Movable Sponge OverlaysCut each HQ zone as a separate, magnet-backed piece. Users can lift, align, or stack them to see extent differences.
  2. Sliding FilmPrint HQ 30 and HQ 100 outlines on transparent acetate (raised ink or puff-paint). Slide the film over the base map; tactile bumps show where water spreads further.
  3. Stackable “Risk Chips”Punch small, uniform discs out of sponge: light-touch discs for HQ 100, rough discs for HQ 30. Drop them into a recessed Danube channel to build a tactile bar-chart of depth along chosen transects.
  4. Add a braille / raised-symbol legend to the bottom edge.
  5. Run a short thinking-aloud test with at least three users, including one low-vision participant.

#14 Preparing to build a prototype

After outlining a national-level idea for a tactile map of Austria in my last post, I quickly realized: starting small is smarter. Not only because of time and material constraints, but because detail matters and working at a regional scale allows me to dive deeper into how elevation, infrastructure, and flood risk actually intersect.

So for my next prototype, I’m focusing on the region around Tulln, and potentially Vienna if time allows. This area offers a compelling intersection of topography, hydrology, and urban development all wrapped around the Danube, Austria’s largest and most flood-prone river.


Why Tulln?

  • It’s a mid-sized town with both urban and rural textures, making it ideal for mixed-surface representation.
  • It lies directly along the Danube, with several documented flood events in recent years.
  • Its relatively flat terrain offers subtle elevation changes—challenging but manageable for tactile representation.
  • Data is available: flood risk mapsland use info, and elevation contours are easier to source at this scale.

Plus: I have a personal reference point for it living close by, which helps in imagining scale and interpretation.


What the Data Says: A Quick WISA Deep-Dive

I spent an evening inside the WISA (WasserInformationsSystem Austria) portal, specifically the second-cycle hazard and risk maps:

https://maps.wisa.bmluk.gv.at/gefahren-und-risikokarten-zweiter-zyklus

Key takeaways:

  1. Three flood scenarios dominate planning: HQ30, HQ100, HQ300 (30-, 100-, 300-year events).
  2. Each scenario maps expected water depth and flow velocity—crucial for picking tactile textures.
  3. In the Tulln/Vienna stretch, HQ100 zones hug both banks, widening dramatically at meander bends.

Material Scouting (aka “Foam Feel-Up” Day)

I’ve been to a few shop looking at different materials to see what would work best.

Prototype Blueprint (Version 0.1)

LayerData SourceTactile Encoding
Elevation (4 bands)data.gv.atcardboard (stacked)
HQ100 flood zoneWISA hazard mapScrub Sponge (Reinigungsschwamm)
Sealed landdata.gv.atcompressed cork board
Green spacedata.gv.atfelt fabric
Danube + major tributariesWISA hazard mapsmooth craft foam

The aesthetic goal isn’t prettiness; it’s readability by hand. Every texture must scream its meaning in under two seconds of fingertip contact.

Scope Check

  • Board size: A4 fits on a lap, lowers material costs, easy for the first prototype
  • Layers: 3–4 elevation steps + 1 sponge overlay = max 5 tactile heights.
  • Geography: Tulln centre + ~5 km buffer on each side; Vienna only if the first build behaves.

Next Up: Cutting, Gluing, (Re-)Cursing

In my next Blog Post I’ll document the messy middle:

  1. Printing and tracing simplified contours.
  2. Foam-board surgery (scalpel + podcasts).
  3. Flood-sponge wrestling: how do you glue something that’s meant to feel like water?
  4. First blindfold test: can a friend locate “safe ground” by touch alone?

Fingers crossed (and hopefully uncut).