Experiment IV: Embodied Resonance – plot HRV metrics with python

Before we can compare a “healthy” and a “clinical” heart, we first need a small tool-chain that does three things automatically:

  1. detects each normal-to-normal (NN) beat in a raw ECG trace,
  2. converts those beats into the core HRV metrics (HR, SDNN, RMSSD, VLF, LF, HF, LF/HF) and
  3. plots every curve on an interactive dashboard so that trends can be inspected side-by-side.

Because the long-term goal is a live installation (eventually driving MIDI or other real-time mappings), the script is written from the start in a sliding-window style: at every step it re-computes each metric over a moving chunk of data.
Fast-changing variables such as heart-rate itself can use short windows and small hops; spectral indices need at least a five-minute span to remain physiologically trustworthy. Shortening that span may make the curves look “lively,” but it also distorts the underlying autonomic picture and breaks any attempt to compare one participant with another. The code therefore lets the user set an independent window length and step size for the time-domain group and for the frequency-domain group.
Let’s take a closer look at the code. If you want to see the full, visit: https://github.com/ninaeba/EmbodiedResonance

1. Imports and global parameters

import argparse
import sys
from pathlib import Path

import numpy as np
import pandas as pd
import plotly.graph_objs as go
import scipy.signal as sg
import neurokit2 as nk
  • argparse – give the script a tiny command-line interface so we can point it at any raw ECG CSV.
  • NumPy / pandas – basic numeric work and table handling.
  • scipy.signal – classic DSP tools (Butterworth filter, Lomb–Scargle).
  • neurokit2 – robust, well-tested R-peak detector.
  • plotly – interactive plotting inside a browser/Notebook; easy zooming for visual QA.

2. Tunable experiment-wide constants

FS_ECG   = 500              # ECG sample-rate (Hz)
BP_ECG   = (0.5, 40)        # band-pass corner frequencies

TIME_WIN, TIME_STEP = 60.0, 1.0   # sliding window for HR / SDNN / RMSSD
FREQ_WIN, FREQ_STEP = 300.0, 30.0   # sliding window for VLF / LF / HF
FGRID = np.arange(0.003, 0.401, 0.001)

BANDS = dict(VLF=(.003, .04), LF=(.04, .15), HF=(.15, .40))
  • Butterworth 0.5–40 Hz is a widely used cardiology band-pass that suppresses baseline wander and high-frequency EMG, yet leaves the QRS complex untouched.
  • 60s time-domain window strikes a balance: long enough to tame noise, short enough for semi-real-time trend tracking.
  • 300s spectral window is deliberately longer; the literature shows that the lower bands (especially VLF) are unreliable below ~5 min.
  • FGRID – dense frequency grid (1 mHz spacing) for a smoother Lomb curve.

3. ECG helper class – load, (optionally) filter, detect R-peaks

class ECG:
def __init__(self, fs=FS_ECG, bp=BP_ECG, use_filter=True):
...
def load(self, fname: Path) -> np.ndarray:
...
def filt(self, sig):
...
def r_peaks(self, sig_f):
...
  1. load – reads the CSV into a flat float vector and sanity-checks that we have >10 s of data.
  2. filt – if the --nofilt flag is absent, applies a 4-th-order zero-phase Butterworth band-pass (via filtfilt) so that the baseline drift of slow breathing (or cable motion) does not trick the peak detector.
  3. r_peaks – delegates the hard work to neurokit2.ecg_process, which combines Pan-Tompkins-style amplitude heuristics with adaptive thresholds; returns index positions and their timing in seconds.

4. HRV class – sliding-window metric engine

class HRV:
...
def time_metrics(rr):
...
def lomb_bandpowers(self, rr, t_rr):
...
def time_series(self, r_t):
...
def freq_series(self, r_t):
...
def compute(self, r_t):
...
  • time_metrics converts every RR sub-series into three classic metrics
    HR (beats/min), SDNN (overall beat-to-beat spread, ms), RMSSD (short-term jitter, ms).
  • Why Lomb–Scargle instead of Welch?
    The RR intervals are unevenly spaced by definition.
    • Welch needs evenly sampled tachograms or heavy interpolation → can distort the spectrum.
    • Lomb operates directly on irregular timestamps, preserving low-frequency content even if breathing or motion momentarily speeds up/slows down the heart.
  • lomb_bandpowers:
    1. Runs scipy.signal.lombscargle on de-trended RR values.
    2. Integrates power inside canonical VLF / LF / HF bands.
    3. Computes LF/HF ratio, but guards against division by tiny HF values.
  • time_series / freq_series slide a window (120 s or 300 s) across the experiment, jump every 30 s, calculate metrics, and store the mid-window timestamp for plotting.
  • compute finally stitches time-domain and frequency-domain rows onto a 1-second master grid so that all curves overlay cleanly.

5. Tiny colour dictionary

COLORS = dict(HR='#d62728', SDNN='#2ca02c', RMSSD='#ff7f0e',
VLF='#1f77b4', LF='#17becf', HF='#bcbd22', LF_HF='#7f7f7f')

Just cosmetic – keeps HR red, SDNN green, etc., across all subjects so eyeballing becomes effortless.


6. plot() – interactive dashboard

def plot(ecg_f, hrv_df, fs=FS_ECG, title="HRV (Lomb)"):
...
  • Left y-axis = filtered ECG trace for QC (do peaks line up?).
  • Right y-axis = every HRV curve.
  • Built-in range-slider lets you scrub the 24-minute protocol quickly.
  • Hover shows exact numeric values (handy when you are screening anomalies).
  • different backgrounds for phases

7. CLI wrapper

if __name__ == '__main__':
main()

Inside main() we parse the file name and the --nofilt flag, run the whole pipeline, save the HRV table as a CSV sibling (same stem, suffix .hrv_lomb.csv) and open the Plotly window.


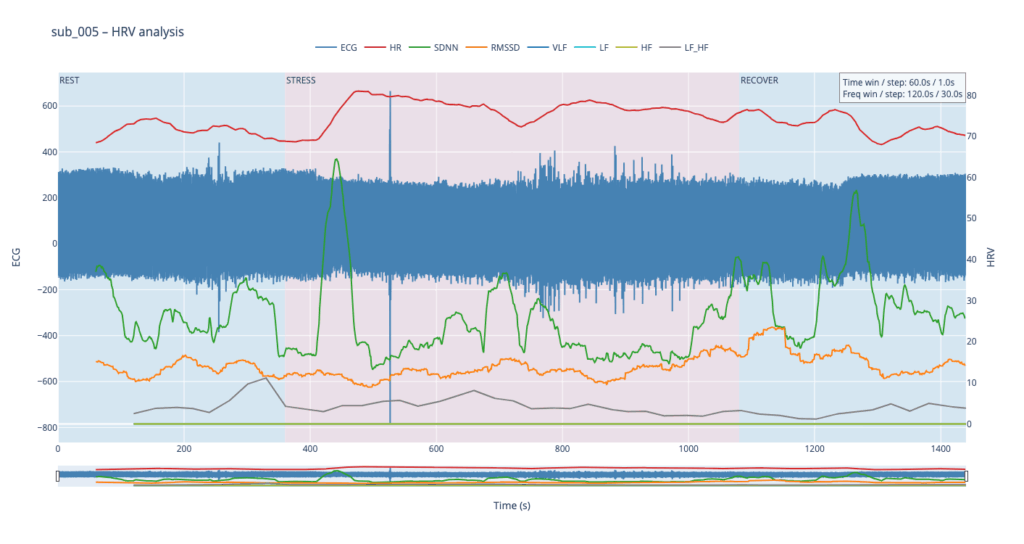
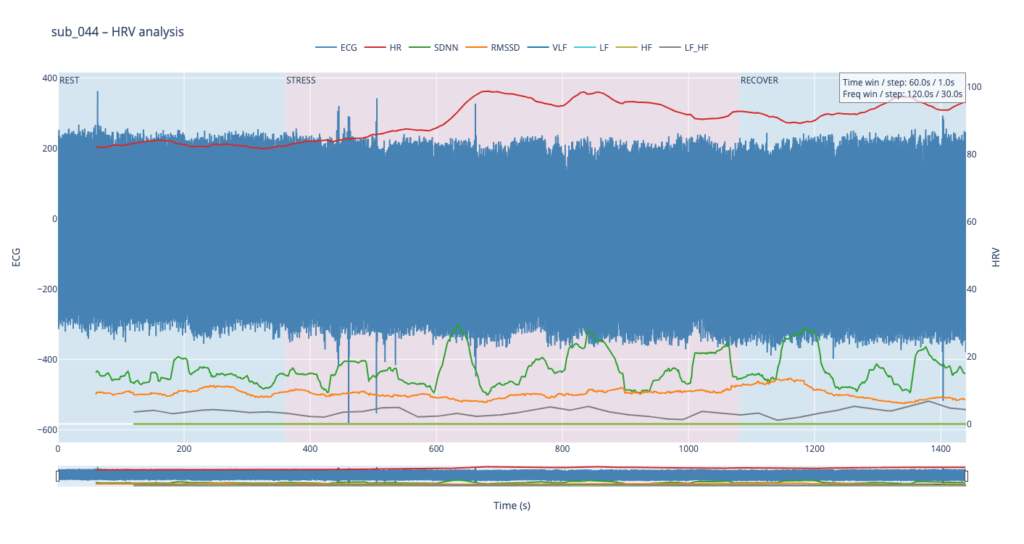
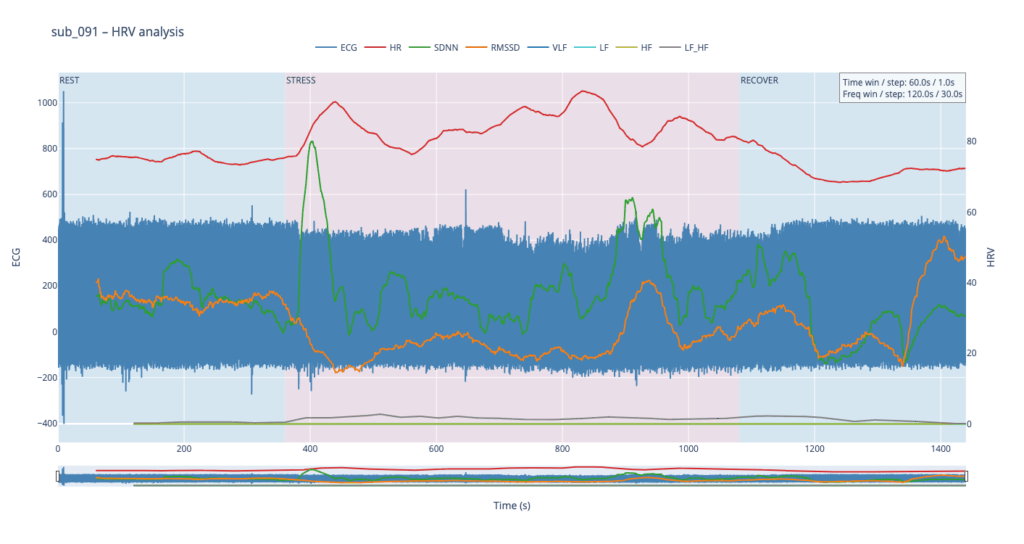
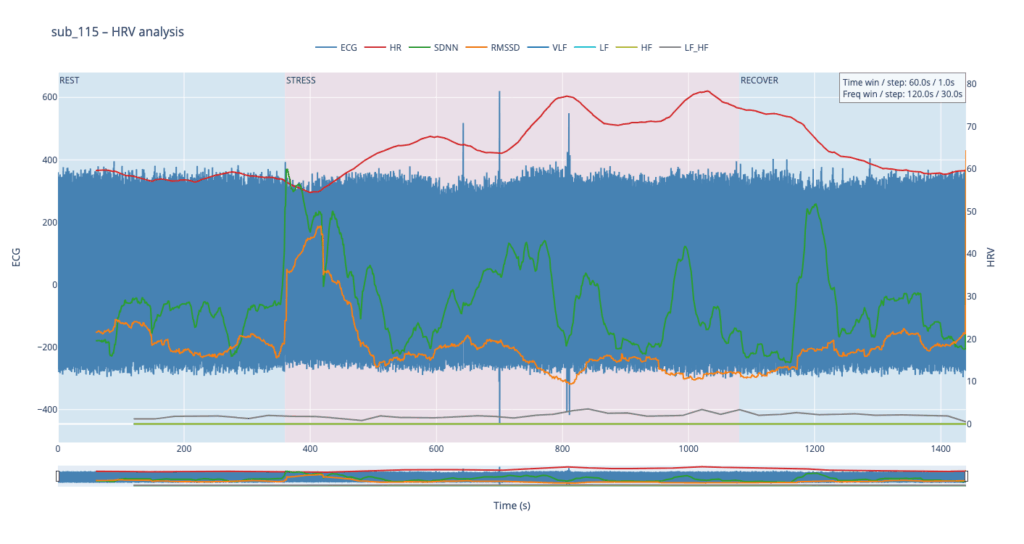
The four summary plots included below are therefore not an end-point but a launch-pad: they give us a quick visual fingerprint of each participant’s autonomic response, and will serve as the reference material for deeper statistical comparison, pattern-searching, and—ultimately—the data-to-sound (or other real-time) mappings we plan to build next.

Experiment III: Embodied Resonance – HRV Metrics and meaning

Heart-rate variability, or HRV, is the tiny, natural wobble in the time gap from one heartbeat to the next. It exists because two automatic “pedals” are always tugging at the heart. One pedal is the sympathetic system, the same chemistry that makes your pulse race when you are startled. The other pedal is the vagus-driven parasympathetic system, the brake that slows the heart each time you breathe out or settle into a chair. The more freely these pedals can trade places, the more variable those beat-to-beat spacings become. HRV is therefore a quick, non-invasive way to listen to how relaxed, alert, or exhausted the body is.

When we measure HRV we usually pull out a few headline numbers.

SDNN is the overall statistical spread of beat intervals during a slice of time, for example one minute. A wide spread means the heart is flexible and ready to react. A very narrow spread means the system is locked in one gear, as happens in chronic stress or heart failure.

RMSSD zooms in on the jump from one beat to the very next, averages those jumps, and reflects how strongly the vagus brake is speaking. During slow, deep breathing RMSSD grows larger; during mental tension or sleep deprivation it falls.

Frequency-domain measures treat the heartbeat trace like a piece of music and ask how loud each note is. Very-low-frequency power, or VLF, comes from extremely slow body rhythms such as hormone cycles and temperature regulation. Low-frequency power, or LF, sits in the middle and rises when the sympathetic pedal is pressed, for example in the first minute of exercise or during mental arithmetic. High-frequency power, or HF, sits exactly at breathing speed and is almost pure vagus activity: it swells during calm, diaphragmatic breathing and shrinks when breathing is shallow or hurried. A simple way to summarise the tug-of-war is the LF-to-HF ratio. When the sympathetic pedal dominates the ratio climbs; when the vagus brake dominates the ratio slides downward.

In a healthy, rested adult who is quietly seated the heart rate is steady but not rigid. SDNN and RMSSD show a modest but clear jitter, HF power pulses in step with the breath, LF is similar in size to HF, and the LF/HF ratio hovers around one or two. If the same person begins brisk walking heart rate rises, HF power fades, LF power grows, and the LF/HF ratio can shoot above five. During slow breathing meditation RMSSD and HF surge while LF/HF drops below one. In someone with chronic anxiety or PTSD the resting pattern is different: SDNN and RMSSD are low, HF is thin, LF/HF is already high before any task, and it climbs even higher during mild stress. The pattern can be even flatter in advanced heart disease, where both pedals are weak and total HRV is minimal.

Put simply, HRV lets us watch the nervous system’s soundtrack: fast notes reflect breathing and relaxation, mid-notes reflect alertness, and the overall volume tells us how much capacity the system still has in reserve.

The raw material for every HRV metric is the NN-interval sequence:
NNi is the time in seconds between two consecutive normal (sinus) beats.

SDNN is the standard deviation of that sequence.

SDNN = √[ Σ (NNi – NN̄)² / (N – 1) ]
Units are milliseconds because the intervals are expressed in ms. A resting, healthy adult who sits quietly will usually show an SDNN between roughly 30 ms and 50 ms. Endurance athletes can sit in the 60–90 ms range, while chronically stressed or cardiac patients may drift below 20 ms.

RMSSD focuses on the beat-to-beat jump and is dominated by parasympathetic (vagal) tone.

RMSSD = √[ Σ ( NNi – NNi-1 )² / (N – 1) ]
Again the unit is milliseconds. Typical resting values in a calm, healthy adult are about 25–40 ms. Slow breathing, a nap, or meditation can push it up toward 60 ms, whereas sustained mental effort, anxiety, sleep deprivation, or PTSD often pull it down below 15 ms.

Frequency-domain indices start from the same NN series but first convert it into a power-spectrum, most accurately with a Lomb–Scargle periodogram when the points are unevenly spaced:

P(f) = (1/2σ²) { [ Σ NNi cos ωi ]² / Σ cos² ωi + [ Σ NNi sin ωi ]² / Σ sin² ωi }
where ω = 2πf and f is scanned from 0.003 Hz upward.

Power is then integrated over preset bands and reported in ms² because it represents variance of the interval series per hertz.

Very-low-frequency power VLF integrates P(f) from 0.003 Hz to 0.04 Hz. In a healthy resting adult VLF is often 500–1500 ms². Because the mechanisms behind VLF (thermoregulation, hormones, renin-angiotensin cycle) change only slowly, values can drift greatly between individuals and between days.

Low-frequency power LF integrates P(f) from 0.04 Hz to 0.15 Hz. A quiet, healthy adult usually sits near 300–1200 ms². LF rises when the sympathetic accelerator is pressed, for example during the first few minutes of exercise or a stressful mental task.

High-frequency power HF integrates P(f) from 0.15 Hz to 0.40 Hz, exactly the normal breathing range. Calm diaphragmatic breathing drives HF toward 400–1200 ms², whereas rapid or shallow breathing in anxiety or hard exercise cuts HF sharply, sometimes below 100 ms².

LF/HF is the simple ratio LF ÷ HF. At rest a ratio near 1–2 suggests a balanced tug-of-war. If the ratio soars above 5 the sympathetic branch is clearly on top; if it falls below 0.5 the vagus brake is dominating (seen in deep meditation or in some fainting-prone individuals).

All of these numbers rise and fall in real time as the two branches of the autonomic nervous system jostle for control, so plotting them across the exercise-rest protocol lets us see how quickly and how strongly each person’s physiology reacts and recovers.

MetricUnitsWhat It Reflects (plain-language)Typical Resting Range in Healthy Adults*When It Runs High (what that often means)When It Runs Low (what that can signal)
Mean Heart Rate (HR)beats per minute (bpm)How fast the heart is beating on average50 – 80 bpmPhysical effort, fever, anxiety, dehydrationExcellent cardiovascular fitness, medications that slow the heart
SDNNmilliseconds (ms)Overall “spread” of beat-to-beat intervals—long-term autonomic flexibility40 – 60 msGood recovery, calm alertness, athletic conditioningChronic stress, heart disease, PTSD, over-fatigue
RMSSDmsVery short-term vagal (rest-and-digest) shifts from one beat to the next25 – 45 msDeep relaxed breathing, meditation, lying downSympathetic overdrive, poor sleep, depression
VLF Powerms²Very-slow oscillations (< 0.04 Hz) tied to long hormonal / thermoregulatory rhythms600 – 2000 ms²Possible inflammation, overtraining, sustained stress loadOften low in severe autonomic dysregulation
LF Powerms²“Middle-speed” swings (0.04–0.15 Hz) from blood-pressure reflex & controlled breathing (~6 breaths/min)600 – 2000 ms²Active mental effort, controlled slow breathing, standing upBlunted baroreflex, autonomic failure
HF Powerms²Fast vagal modulation (0.15–0.40 Hz) synchronized with normal breathing (3–9 breaths/min)500 – 1500 ms² (age-dependent)Relaxation, slow diaphragmatic breathing, lying downAnxiety, rapid shallow breathing, fatigue
LF/HF Ratio— (dimension-less)Balance of sympathetic “drive” (LF) vs vagal “brake” (HF)0.5 – 2.0Acute psychological stress, caffeine, upright postureExcess vagal tone, certain medications, autonomic failure