RECAP:
Embodied Resonance investigates how the body of a person with lived experience of war responds to auditory triggers that recall traumatic events, and how these responses can be expressed through sound. The heart is central to this project, as cardiac activity – particularly heart rate variability (HRV)—provides detailed insight into stress regulation and autonomic nervous system dynamics associated with post-traumatic stress disorder (PTSD).
The conceptual direction of the work is shaped by my personal experience of the war in Ukraine and an interest in trauma physiology. I was drawn to the idea that trauma leaves measurable traces in the body—signals that often remain inaccessible through language but can be explored scientifically and translated into sonic form. This approach was influenced by The Body Keeps the Score by Bessel van der Kolk, which emphasizes embodied memory and non-verbal manifestations of trauma.
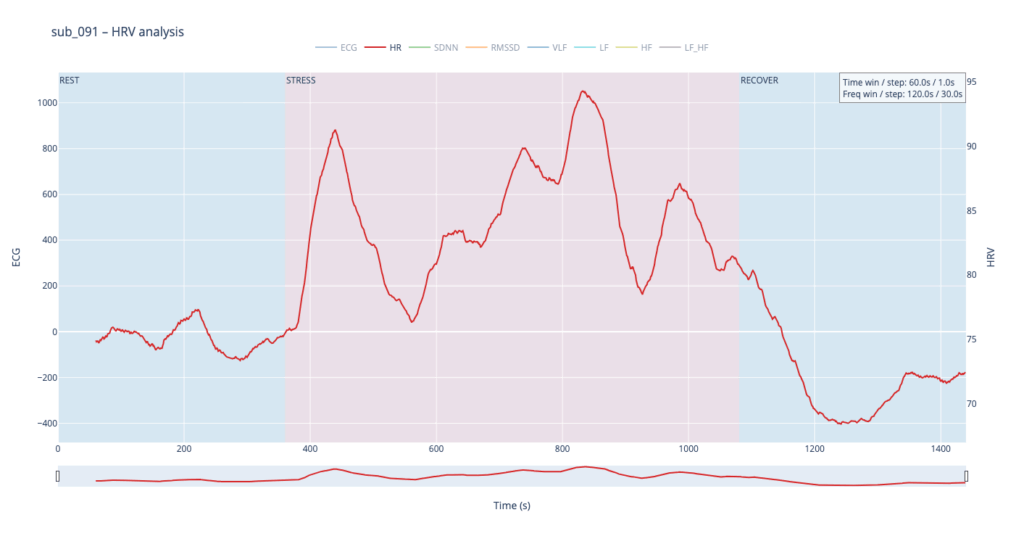
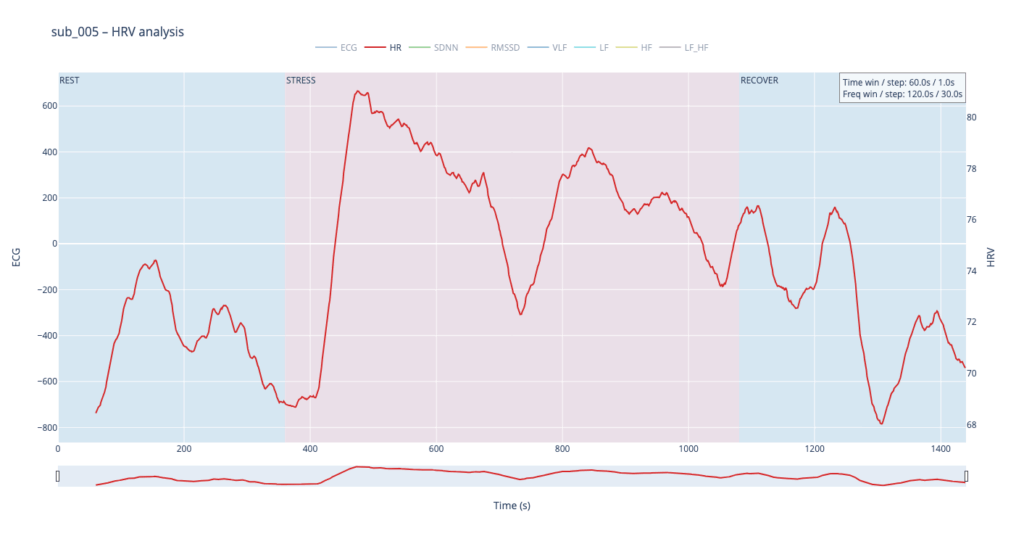
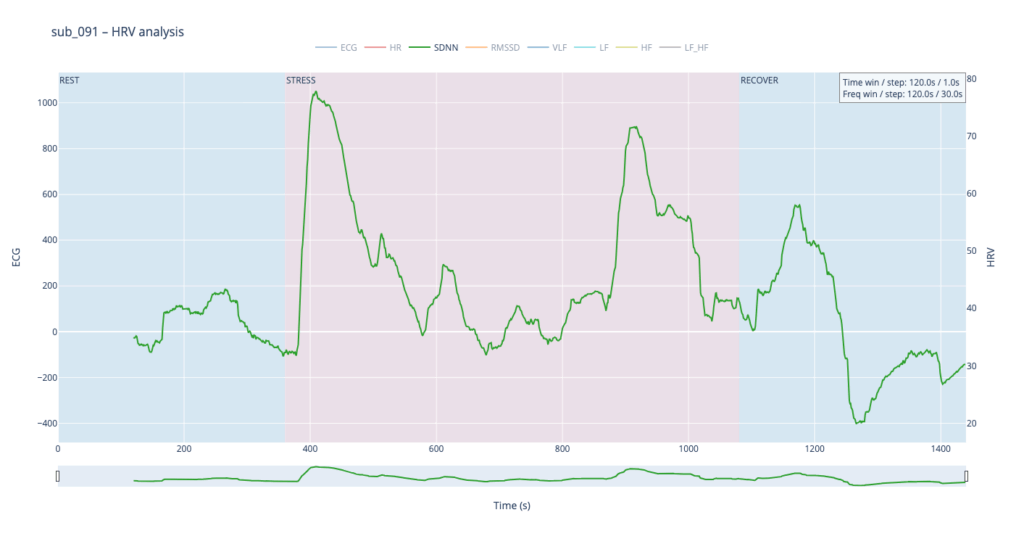
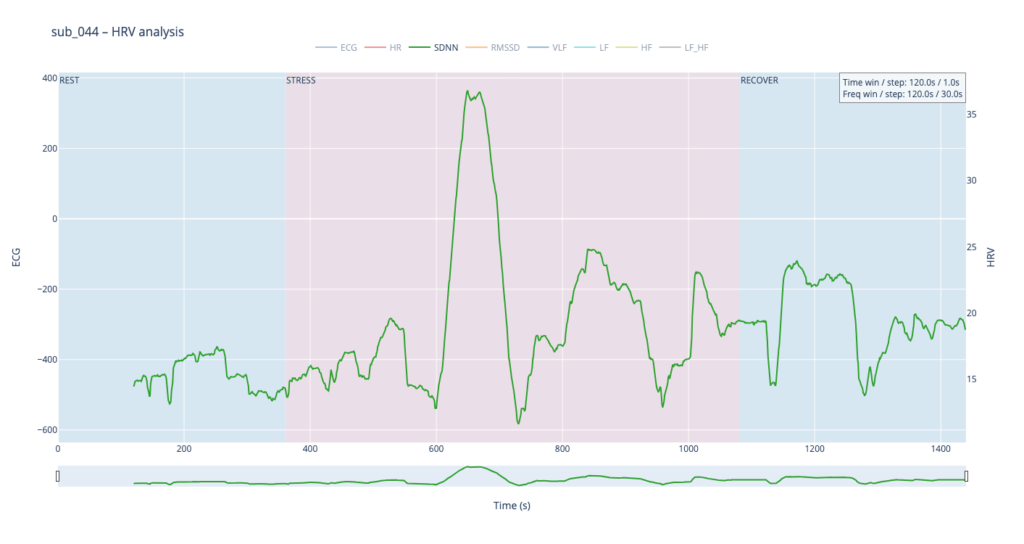
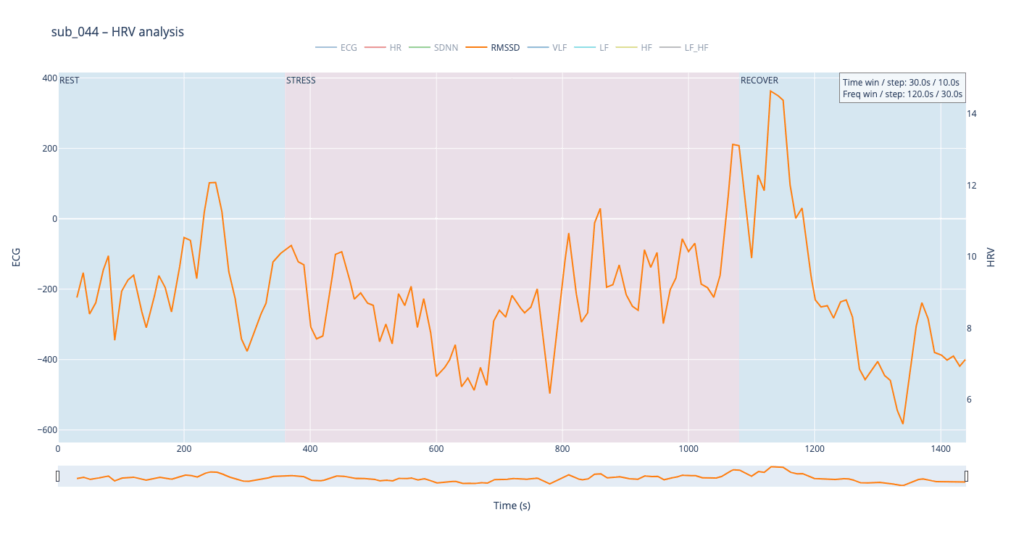
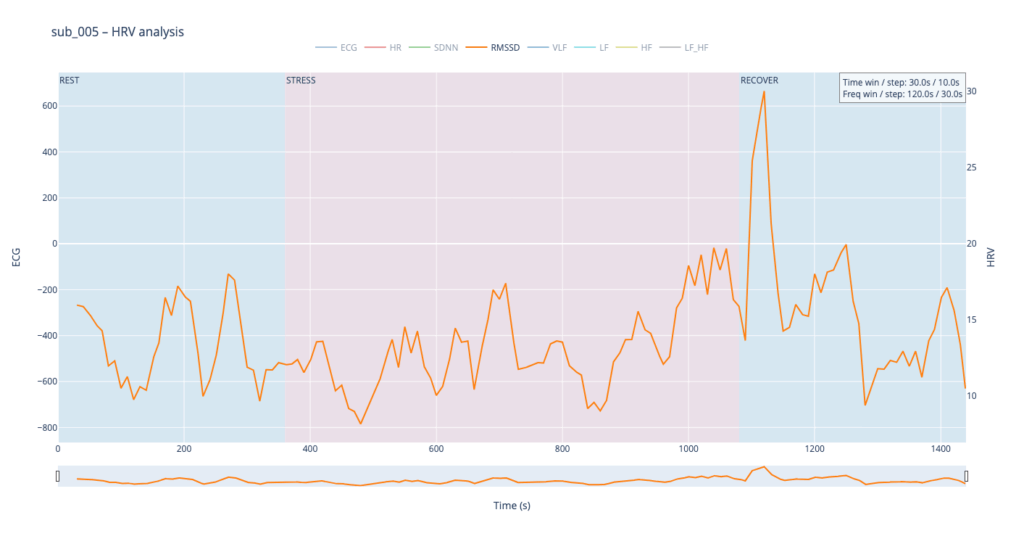
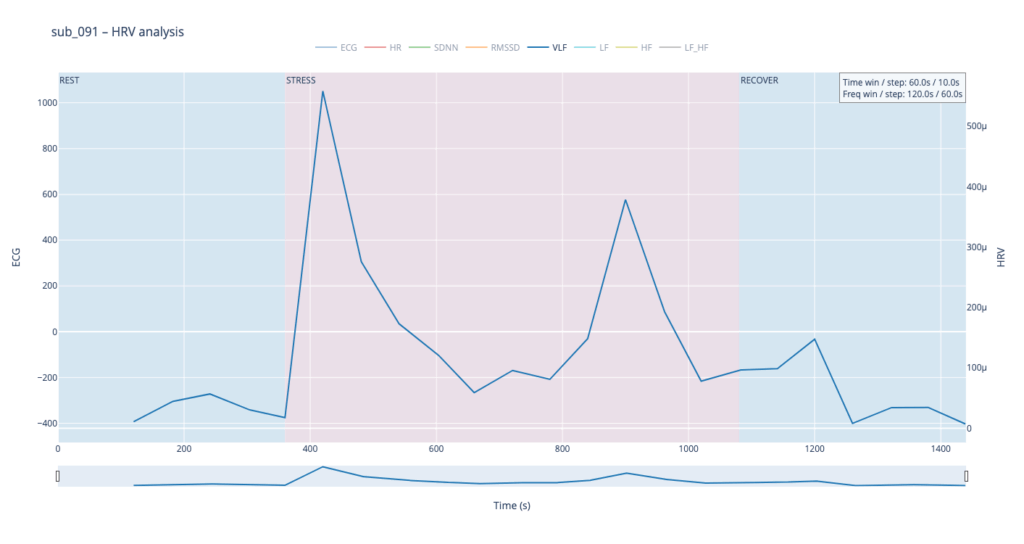
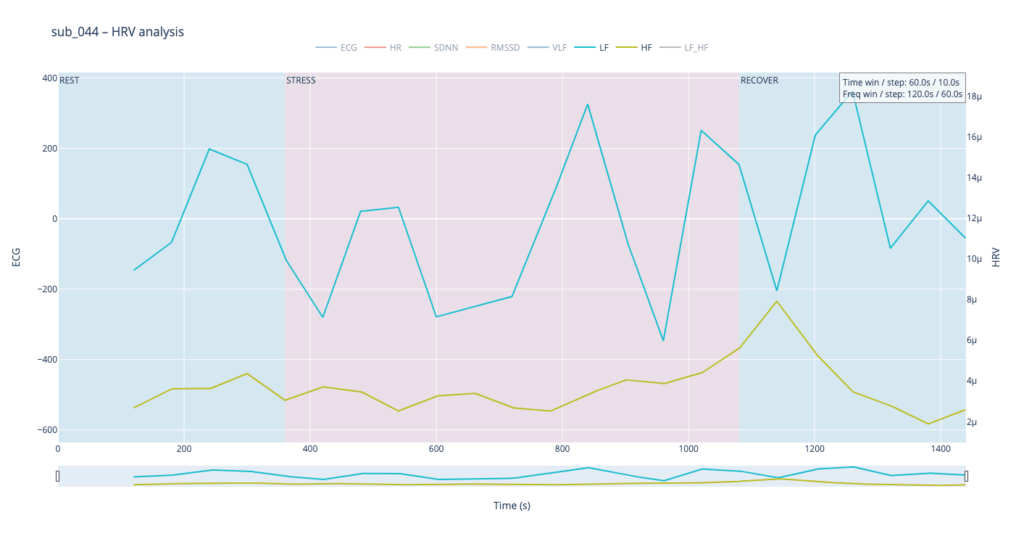
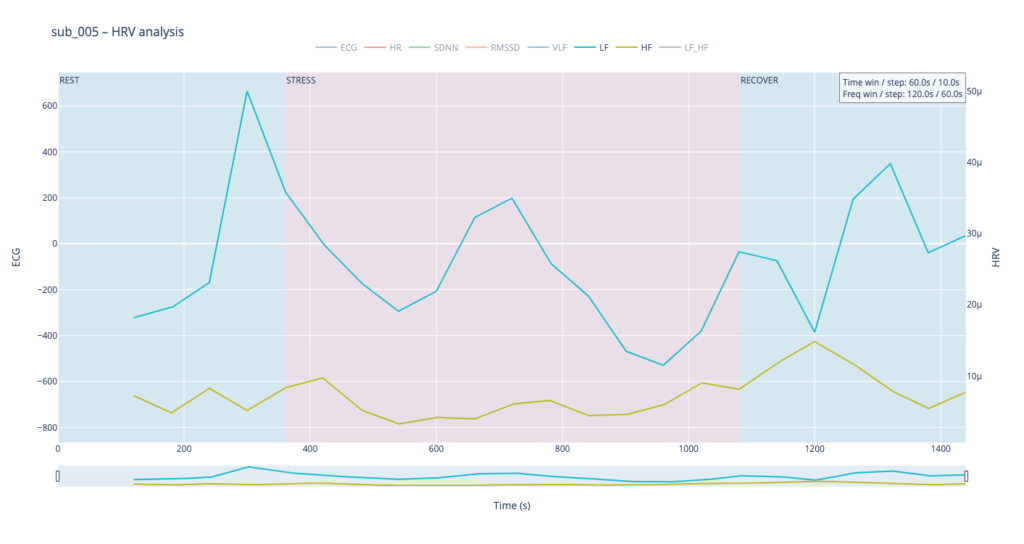
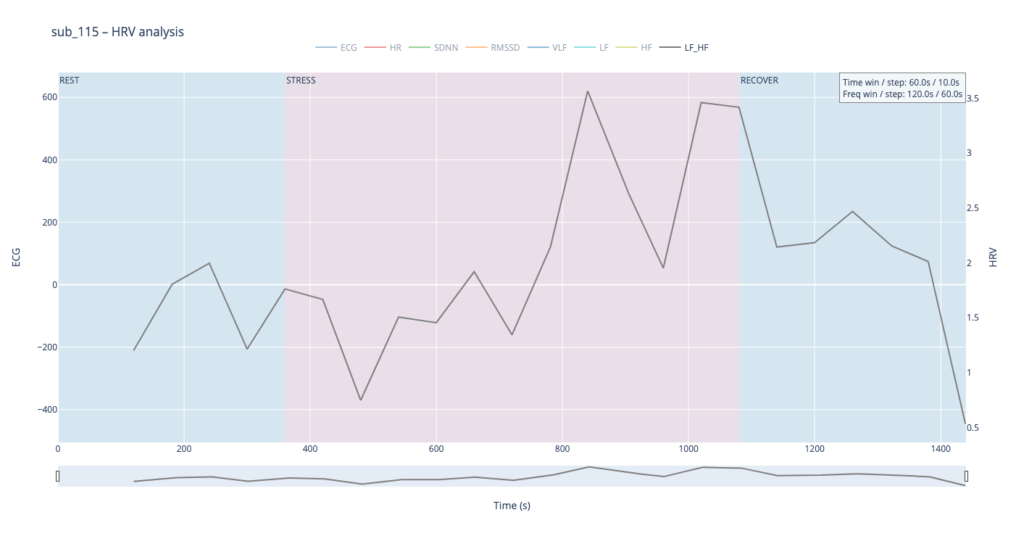
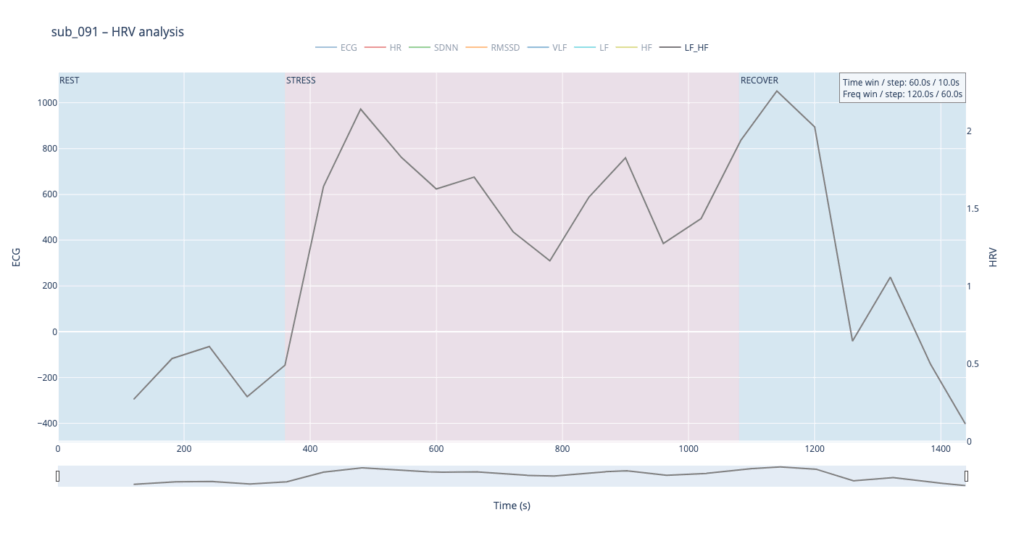
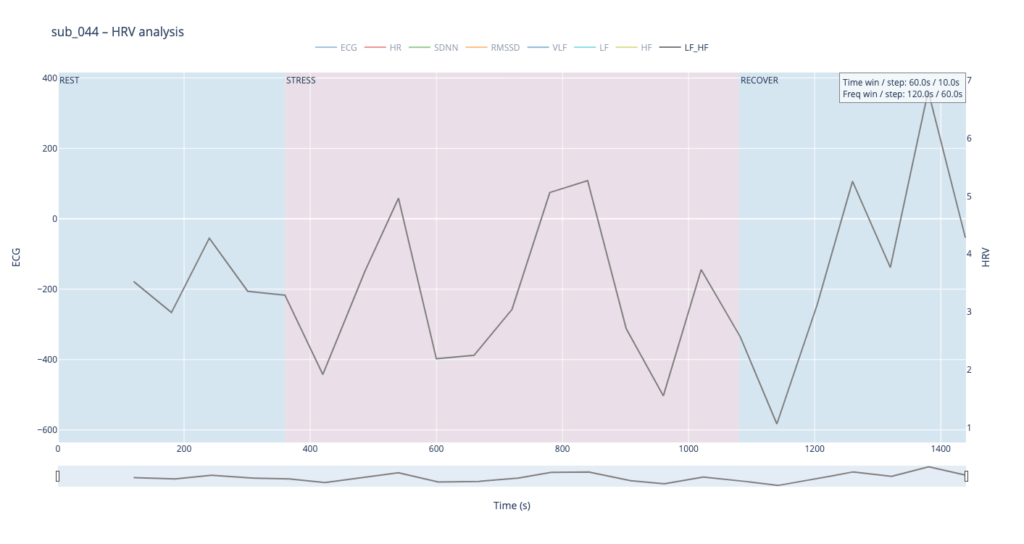
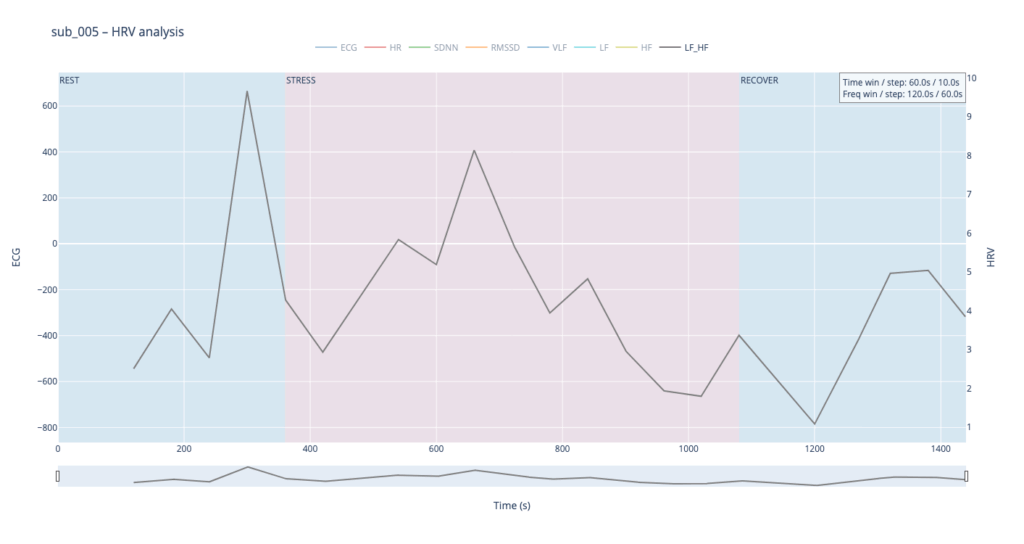
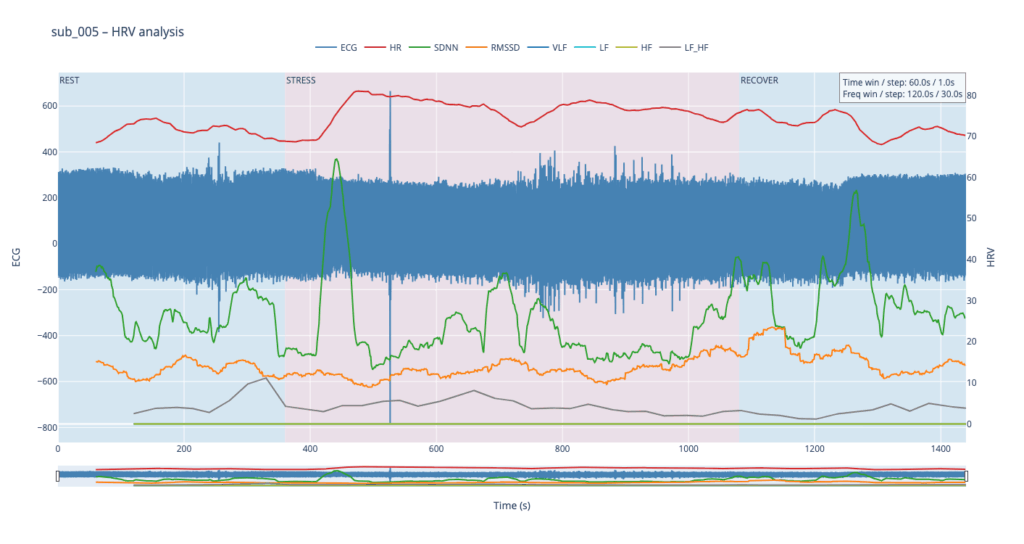
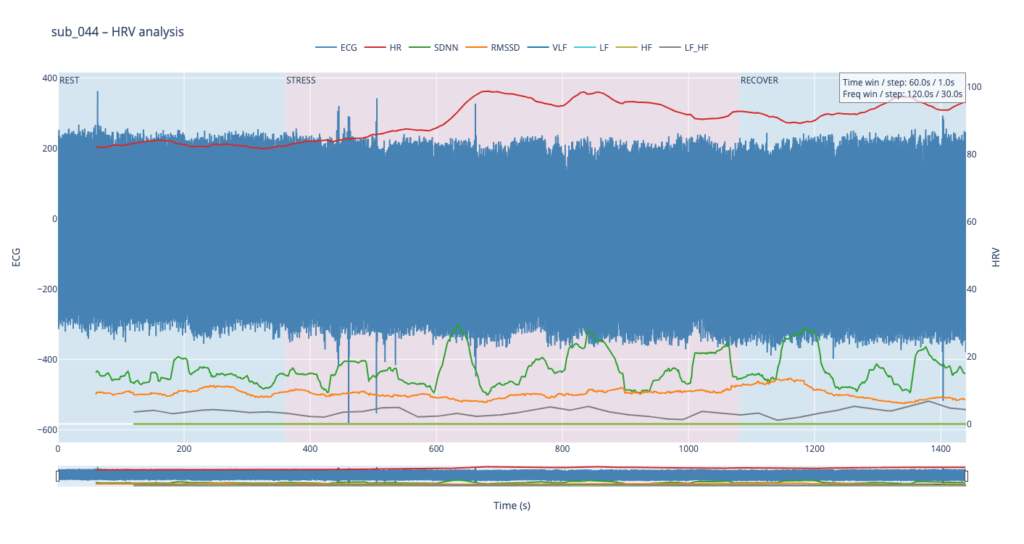
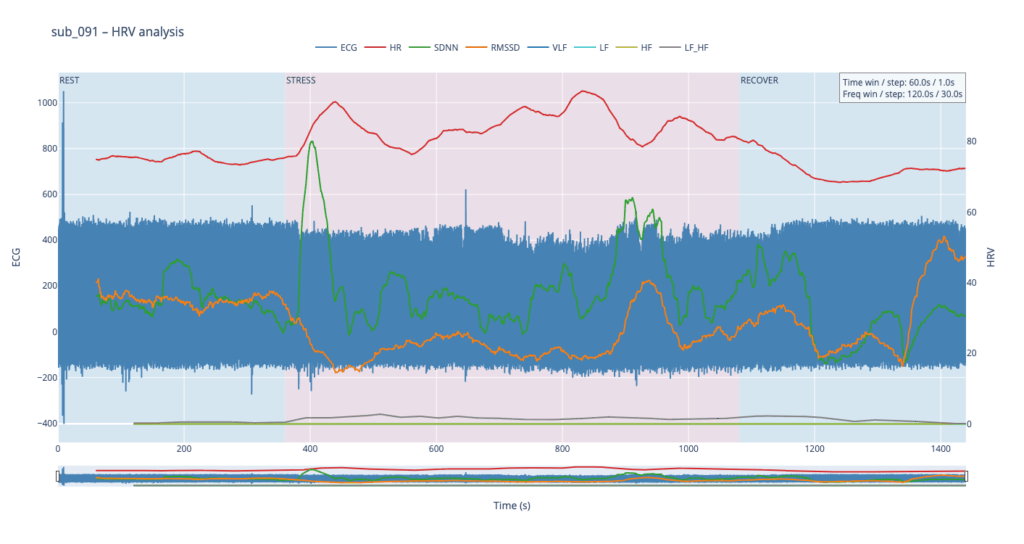
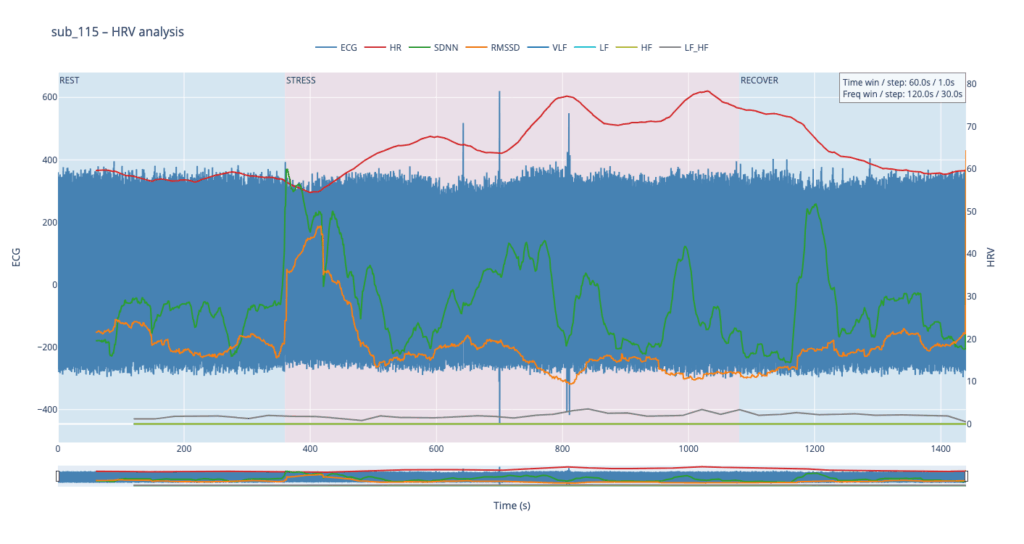
In the previous semester, the project focused on exploratory work with existing physiological datasets. A large open-access dataset on stress-induced myocardial ischemia was used to study cardiac behavior under rest, stress, and recovery conditions. Although not designed specifically for PTSD research, the dataset includes participants with PTSD, anxiety-related disorders, and cardiovascular conditions, offering a diverse basis for analysis.
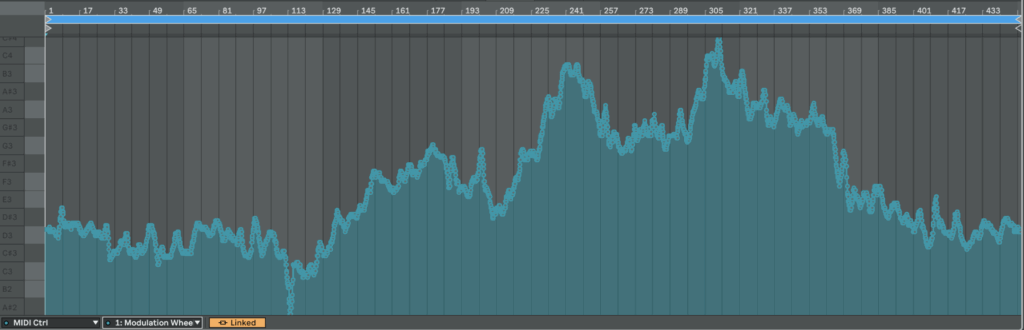
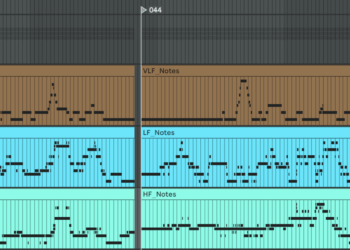
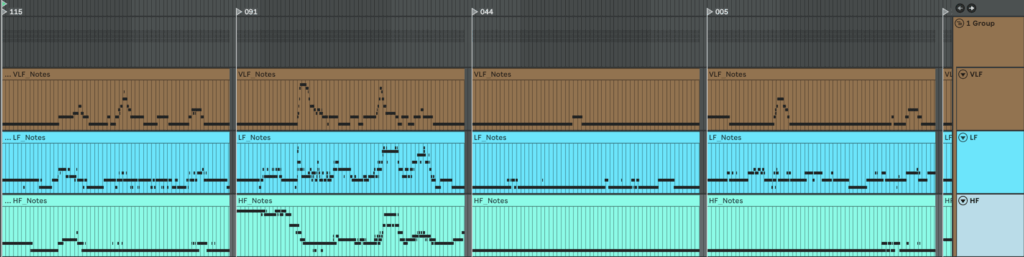
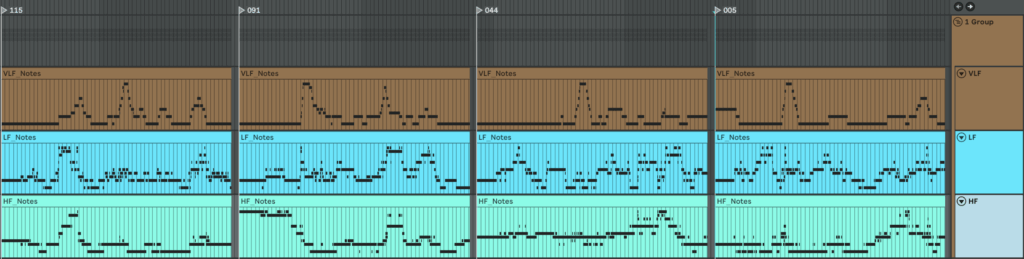
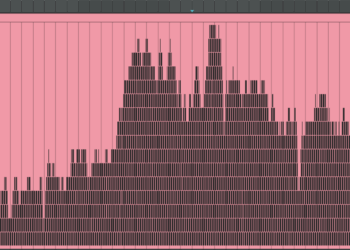
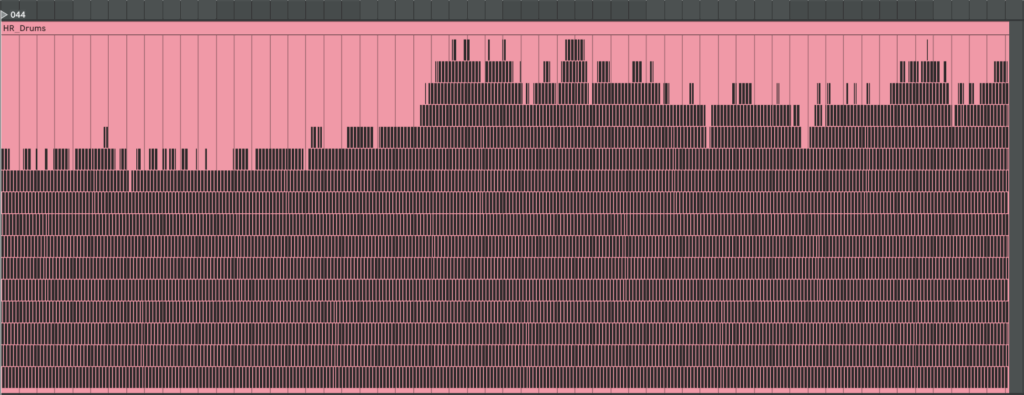
During this phase, Python tools based on the NeuroKit2 library were developed to compute time- and frequency-domain HRV metrics from ECG recordings. Additional scripts transformed these parameters into MIDI patterns and continuous controller (CC) data for sound synthesis and composition. Initial experiments with real-time HRV streaming were also conducted, but they revealed significant limitations: many HRV metrics require long analysis windows and are computationally demanding, making them unsuitable for stable real-time sonification.
In the current semester, corresponding to the Product phase, the project transitions from simulation-based exploration to work with my own body. During earlier presentations, concerns were raised regarding the ethical implications of experiments that could potentially lead to re-traumatization, particularly when involving other participants with war-related trauma. In response, I decided not to extrapolate the experiment to other Ukrainians at this stage and to limit the investigation to my own physiological responses.
Furthermore, instead of exposing myself to recorded sirens at arbitrary times, I chose to record my ECG during the weekly civil defense siren tests that take place every Saturday in Graz. This context offers a meaningful contrast: for most residents of Austria, the siren test is a routine element of everyday life, largely stripped of emotional urgency. For someone with lived experience of war, however, the same sound carries associations of immediate danger. By situating the recordings within this real, socially normalized setting, the project examines how a familiar public signal can produce profoundly different embodied responses depending on personal history.
Before starting the experimental recordings, it was necessary to select and acquire appropriate sensors and a microcontroller. Prior to purchase, a short survey of available biosensing hardware was conducted, with particular attention paid to signal quality, availability of documentation, and the existence of example projects demonstrating practical use. An additional criterion was whether the sensors had been previously employed in projects related to heart rate variability (HRV) analysis.
For ECG acquisition, the DFRobot Gravity Heart Rate Monitor Sensor was selected. This sensor offered a favorable balance between cost and functionality, providing all required cables as well as disposable electrodes. Importantly, it had been used in a well-documented HRV-focused project, which served as a valuable technical reference during development and troubleshooting. In addition to ECG, a galvanic skin response (GSR) sensor from Seeed Studio was included to explore changes in skin conductance as an additional physiological marker of stress. While GSR was not part of the previous semester’s research, it was included experimentally to assess whether this modality could provide complementary information. At this stage, the structure and usefulness of GSR data were not yet fully predictable and were treated as exploratory. As a microcontroller, the Arduino MKR WiFi 1010 was chosen.
The full list of acquired components is as follows:
- Arduino MKR WiFi 1010
- DFRobot Gravity Heart Rate Monitor Sensor (ECG)
- DFRobot Disposable ECG Electrodes
- Seeed Studio GSR Sensor
- Seeed Studio 4-pin Male Jumper to Grove Conversion Cable
- Breadboard (400 holes)
- Male-to-male jumper wires
- Male-to-female jumper wires
- Potentiometers (100 kΩ)
- LiPo Battery 1S 3.7 V 500 mAh (not used in final setup)
The total cost of the hardware provides amounted to approximately 80 EUR. The initial motivation for this choice was the possibility of wireless data transmission via WiFi or Bluetooth. In practice, however, wireless communication was not required. Due to the high motion sensitivity of both ECG and GSR sensors, recordings had to be performed in a largely static position, making a wired USB connection to the computer sufficient. For this reason, a battery intended for mobile operation was ultimately not used.
For software configuration, the Arduino IDE was installed. Although I had prior experience working with Arduino hardware several years ago, the interface had changed significantly. To support the Arduino MKR WiFi 1010, the SAMD Boards package was additionally installed via the Boards Manager. After software setup, all components were connected according to a simple wiring scheme that required no additional electronic elements.
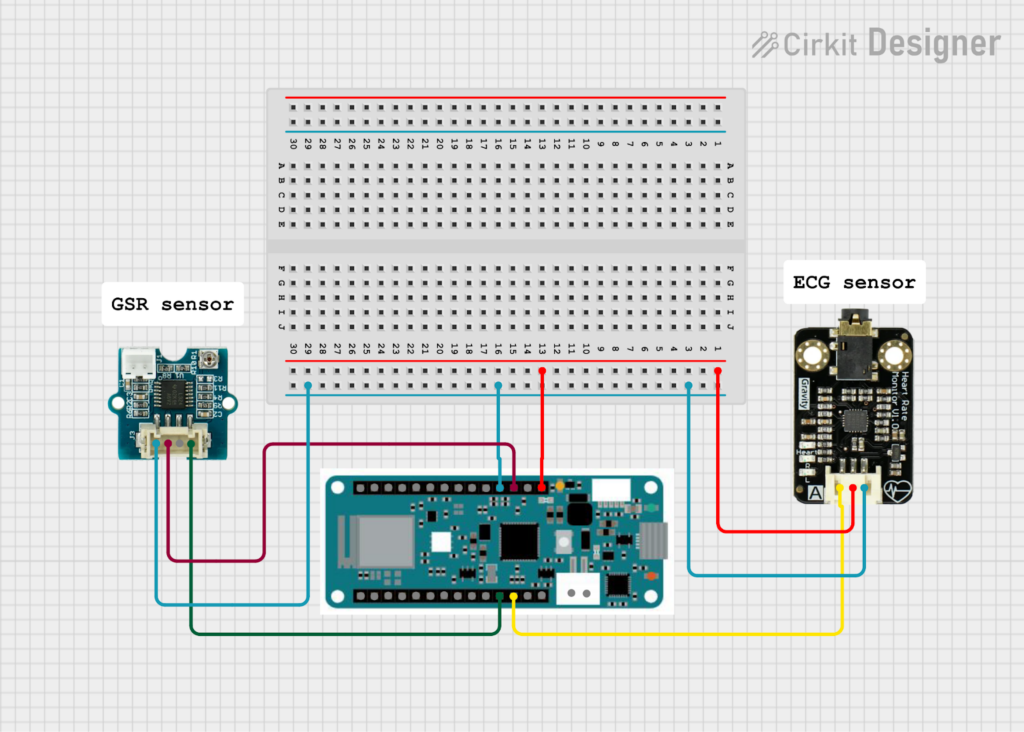
Figure 1. Wiring diagram of the experimental setup with Arduino MKR WiFi 1010, ECG sensor, and GSR sensor.
The Arduino ground (GND) was connected to the ground rail of the breadboard, and the 5 V output was connected to the power rail.
The ECG sensor was connected as follows:
GND (black wire) → ground rail on the breadboard
VCC (red wire) → 5 V power rail
Signal output (blue wire) → analog input A1 on the Arduino
The GSR sensor was connected as follows:
GND (black wire) → ground rail on the breadboard
VCC (red wire) → 3.3 V output on the Arduino
Signal output (yellow wire) → analog input A2 on the Arduino
Figure 2 illustrates the complete wiring configuration of the system, including the Arduino MKR WiFi 1010, ECG sensor, GSR sensor, and breadboard power distribution.
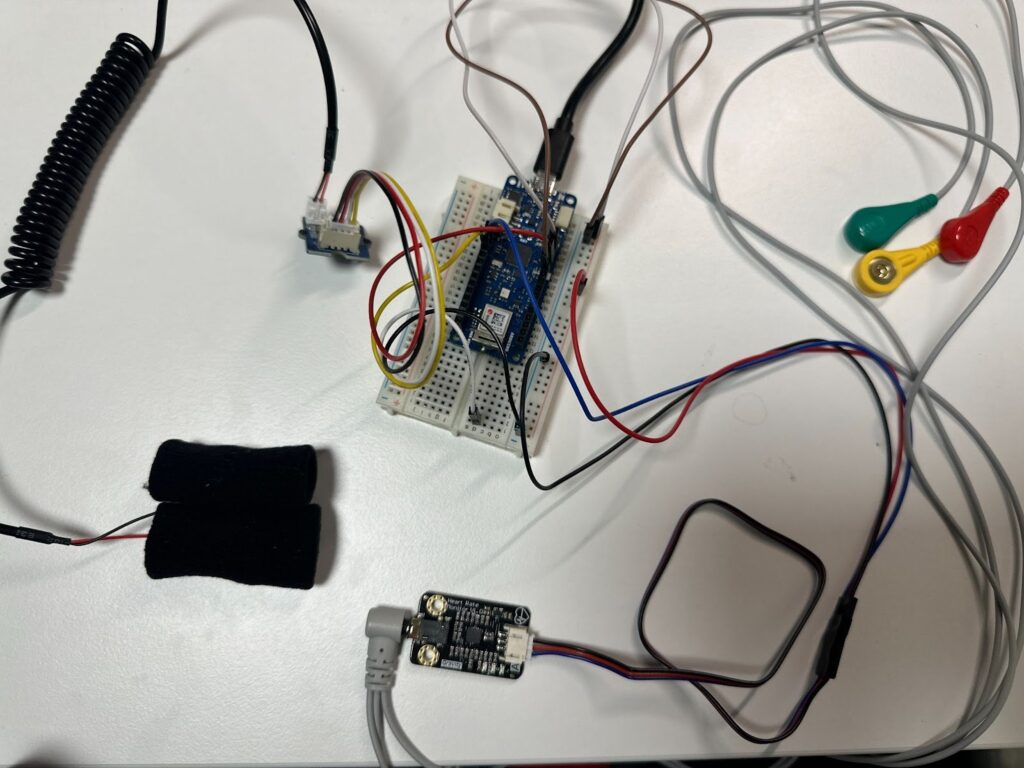
Figure 2. Physical hardware configuration used for ECG and GSR data recording.