During a past project, I started working with data about Austria’s annual CO2 emissions. I created my own dataset using global emission data, filtered down by country and year—all done with Python, which I was using for the first time, very interesing technology—so convenient. It was a bit of a learning curve, but also really cool to see the results take shape.
One thing that stood out was how certain moments in history, like war times, had a visible effect on the emission levels. That connection between historical events and environmental data got me thinking: how can I turn this into something people can interact with and experience beyond just reading numbers?
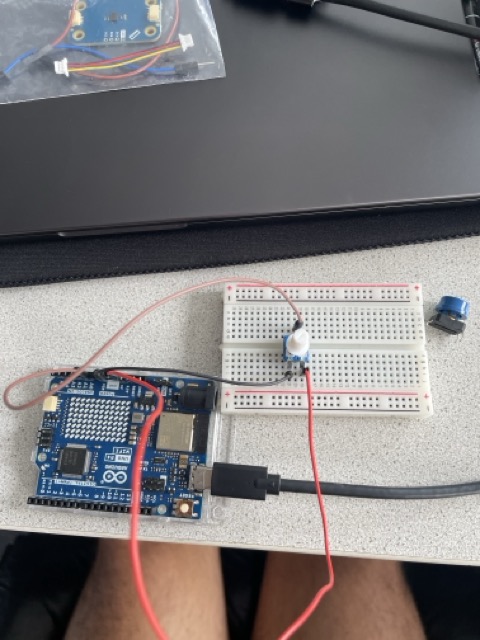
From Makey Makey to Arduino
I started with a simple setup using Makey Makey to build a basic interaction. It worked for a quick demo, but I quickly realized I wanted more control and flexibility. So now, I’m shifting to Arduino. I found a few components at the FH lab and I’m planning to use those to build something more responsive and physical. I’m not totally sure yet how I want everything to work, but I’m interested in seeing how these parts could represent parts of the data—like maybe scrubbing through time or showing intensity of emissions with light or movement.
Just Starting to Explore
Right now, I don’t have a clear final concept, and I’m okay with that. This part of the process is more about experimenting, testing out ideas, and seeing what happens when the data meets the physical world. I think there’s a lot of potential in making climate data more tangible—not just for me, but for others who might interact with it. So my next step is to start playing with the Arduino board, hook up the sensors, and just try stuff. Maybe something will click, maybe I’ll go in a totally new direction. Either way, I’m curious to see where it leads.