One of my favorite sessions on the first day was the workshop “Creating an Effective & Beautiful Data Visualisation from Scratch” by Nadie Bremer. She’s well-known profesionall, that created data visualizations for organizations like Google News Lab, UNICEF, and The New York Times
What really surprised me about this workshop was how hands-on it was, Nadie started with a completely blank screen and gradually built a stunning chart using d3.js (a JavaScript library for data visualization). Watching her go from scratch to a fully developed visual step by step was really engaging.
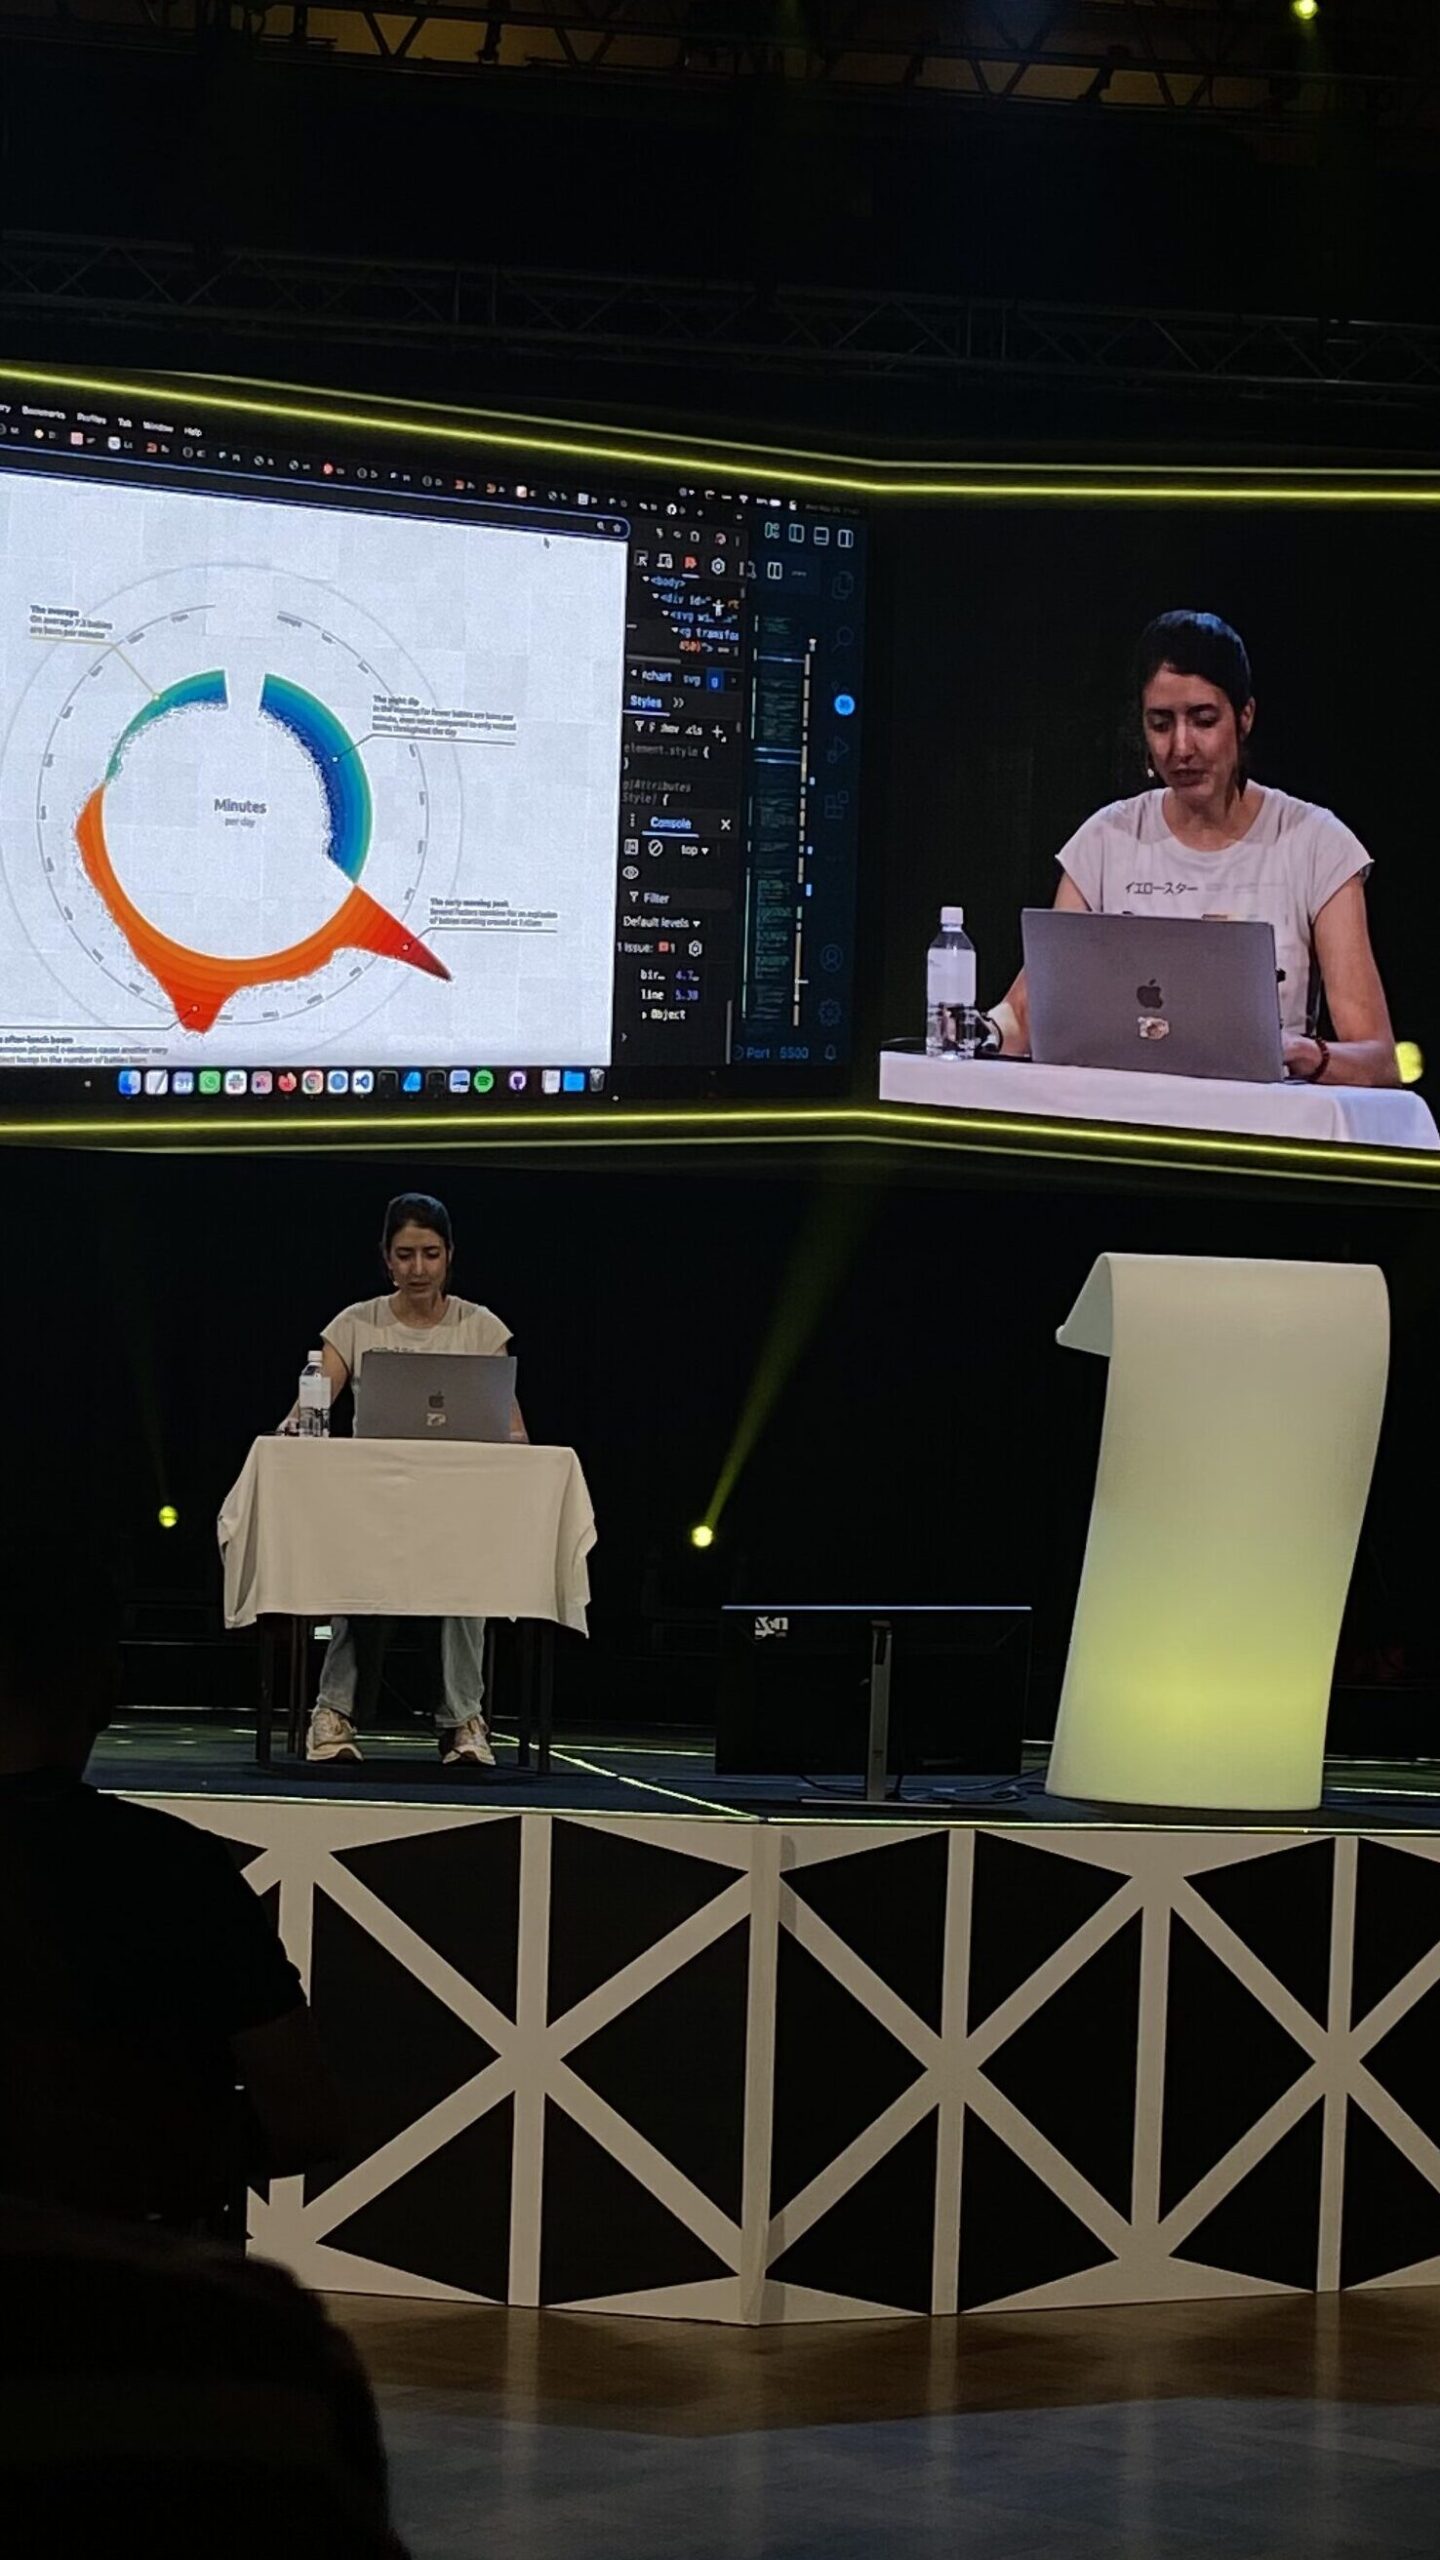
To be honest, I didn’t understand every part of the code she used, especially when she went into more technical things like indexes, cosine, and sine functions. But I could follow the general concept and the logic behind how she built the structure and visual elements. Even without knowing all the technical details, it was exciting to see how math and design came together in such a creative way.
What made this especially interesting to me was how relevant it felt to what I want to do. I’ve been thinking a lot about how to make dashboards more appealing. Most of them use the same types of basic charts, which get the job done but aren’t very exciting. Nadie’s approach showed how much more engaging and beautiful charts can be, without losing clarity.
She also shared some helpful tips about design decisions, like choosing the right color palette, how to simplify complex data, and how to guide the viewer’s attention with layout and motion. These small things make a big difference when it comes to making information easy to understand.
Even though I don’t remember coding very well, I’ve always been interested in it, and this workshop really made me want to dive back in and learn more. It made coding feel less intimidating and reminded me that there’s a creative side to it, especially when it’s used to tell a story through data.
Overall, I left the session feeling inspired. It was a great example of how technical skills and artistic thinking can come together. I’d definitely recommend checking out Nadie Bremer’s work if you’re curious about creative data visualization.