#03 Multisensory Examples

NASA’s data sonification project converts astronomical observations into sound. By assigning different frequencies or instruments to distinct wavelengths of light (X-ray, optical, infrared), cosmic phenomena such as the Bullet Cluster, Crab Nebula, and Supernova 1987A can be “heard”. These audio interpretations highlight features like dark matter, spinning neutron stars, and supernova shockwaves, providing a new, immersive way to experience and understand the universe.


https://hydrologicalsoundscapes.github.io

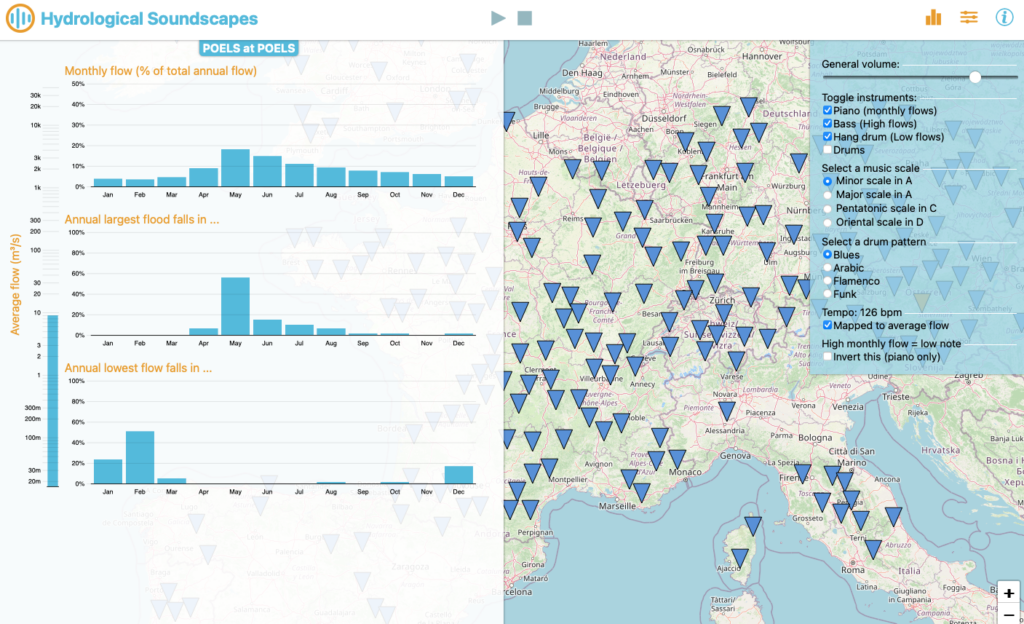
Hydrological Soundscapes | Ivan Horner and Benjamin Renard (2023)

This app visualizes river hydrological data from thousands of global hydrometric stations in both bar charts and musical form. Each of four hydrological variables (average flow, monthly flows, monthly frequency of annual daily maxima, and monthly frequency of annual 30-day averaged minima) controls different musical elements, such as tempo, pitch, volume, and instrument choice. Users are encouraged to wear headphones for the best experience and can either follow a brief tutorial or start exploring immediately.

Reference

https://sonification.design


This passage describes a musical representation of library traffic patterns throughout the year. Each “row” of notes corresponds to a different time of day (weeks, mornings, afternoons/evenings, and nights) and is placed in a progressively higher pitch range. School breaks, weekends, and term times are reflected in gaps or surges in the music, illustrating how library hours and visitor numbers change across the summer, fall, winter, and spring quarters. Nights are only represented during school terms, highlighted by two-note arpeggios in the highest pitch range.

https://mlaetsc.hcommons.org/2023/01/18/data-sonification-for-beginners


Multisensory Data: Insights from “DATA AND DASEIN”

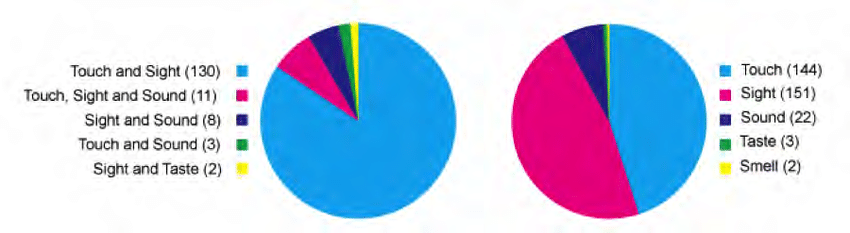
In the dissertation “DATA AND DASEIN – A Phenomenology of Human-Data Relations,” by T. Hogan a review of 154 data representations revealed that most rely on sight (151) and touch (144) to interpret data (Figure 1, B). A smaller subset (22) also incorporated sound, and even fewer tapped into taste or smell. Moreover, 139 examples combined both sight and touch, while only 11 used more than two sensory channels (Figure 1, A).

Figure 1: A: Pie chart (right): distribution of sensory modalities used in combination with other modalities. B: Pie chart (left): Combinations of sensory modalities.

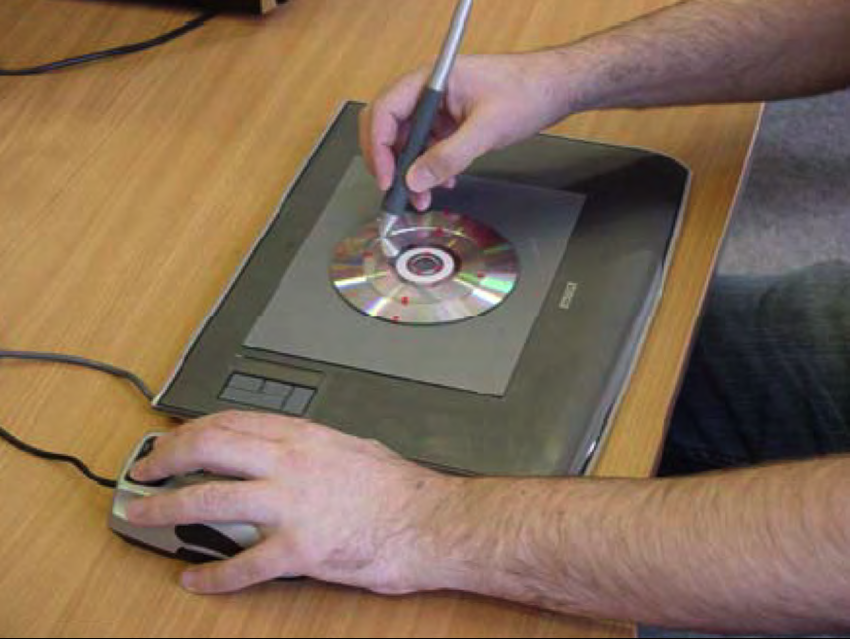
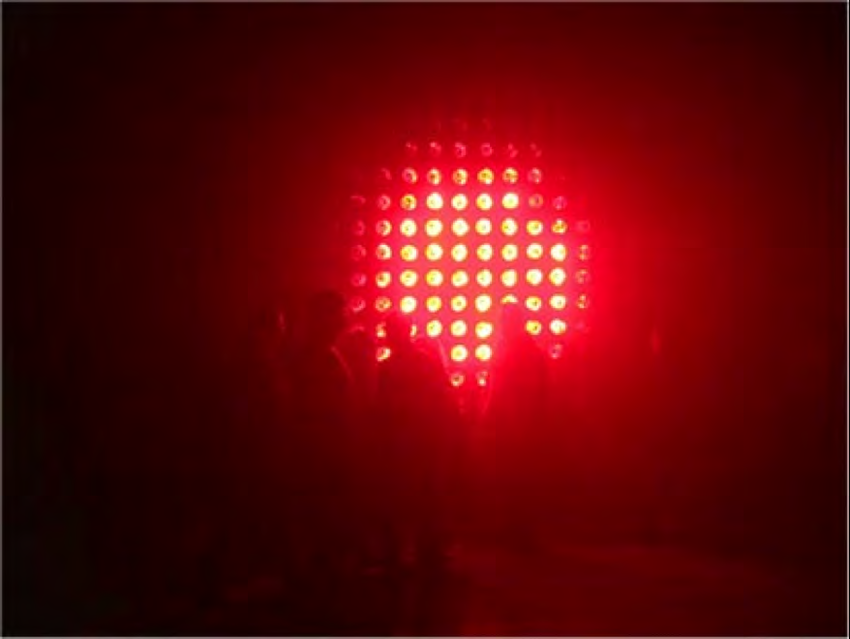
One standout example is Tac-tile (Figure 2), designed for visually impaired users. By combining tactile (via vibrotactile feedback through a stylus) and auditory (adjusting pitch through speakers) elements, Tac-tile highlights how multiple modalities can enable a richer, more inclusive data exploration. This concept extends beyond assistive technology: artist Ryoji Ikeda’s Data.anatomy[civic] [2] merges audio and dynamic graphics to immerse audiences in the intricate data driving Honda Civic car design. Meanwhile, Perpetual (Tropical) SUNSHINE [3] (Figure 3) uses infrared light bulbs to convey real-time temperature data from stations around the Tropic of Capricorn, translating environmental data directly into heat and light. And in more experimental territory, Data Cuisine by Moritz Stefaner [4] explores taste, smell, and sight to transform data into “edible diagrams.”

Figure 2: Tac-tile system. Graphics tablet augmented with a tangible pie chart relief, with dynamic tactile display [1]
Figure 3: Perpetual (Tropical) SUNSHINE by fabric

These examples underscore the creative possibilities of thinking beyond purely visual representations. When designers and researchers integrate multiple sensory channels, they can unlock new forms of engagement, accessibility, and emotional resonance.

Reference

T. Hogan, Data and Dasein – A Phenomenology of Human-Data Relations, Ph.D. dissertation, Bauhaus-Universität Weimar, Weimar, Germany, 2016, sect. 5.5.1.1 (Sensory Modalities).

[1] Steven A. Wall and Stephen A. Brewster. “Tac-tiles: Multimodal Pie Charts for Visually Impaired Users.” In: Proceedings of the 4th Nordic conference on Human-computer interaction changing roles – NordiCHI ’06. Association for Computing Machinery (ACM), 2006. doi: 10.1145/1182475.1182477. url: https://doi.org/10.1145%2F1182475.1182477.
[2] Ryoji Ikeda. data.anatomy.civic. website. 2012. url: http://dataanatomy.net/.
[3] fabric | ch. Perpetual (Tropical) SUNSHINE. (2006). website. 2012. url: http://www.fabric.ch/pts/.
[4] Moritz Stefaner. Data Cuisine. website. 2014. url: http://data-cuisine.net/.

#02 Human Senses

How do different combinations of visual, auditory, and tactile cues influence users’ ability to detect and interpret complex pattern in data?

Human Senses and Beyond

When we talk about the human senses, the classic list of sight, sound, smell, touch, and taste usually comes to mind. However, there is growing evidence that humans perceive the world through far more than these five fundamental channels. In addition to balance, proprioception (awareness of body position), and temperature sensation, researchers continue to uncover other nuanced ways in which we sense and interpret our surroundings.
https://aeon.co/videos/aristotle-was-wrong-and-so-are-we-there-are-far-more-than-five-senses

For the scope of this research, I will concentrate on sight, sound, and touch—particularly regarding how data can be represented and experienced through these modalities.


Accessibility in Design

In modern design practice, accessibility is a fundamental principle rather than an afterthought. Whether creating websites, data visualizations, or interactive installations, designers should integrate accessibility guidelines from the start. These guidelines typically include:

  • Color Contrast and Shape Differentiation
    Ensuring legibility and clarity for individuals with various visual abilities, including color blindness.
  • Alternative Text and Descriptions
    Providing alt text for images and clear labeling for data charts to support screen readers.
  • Flexible Interaction Methods
    Offering keyboard or alternate navigation modes for users who cannot interact with a mouse or touch interfaces.

Adhering to these practices benefits not just users with disabilities; it often leads to improved usability and clarity for everyone.
https://accessibility.huit.harvard.edu/data-viz-charts-graphs

Listen, Feel, Hear the Data

Sonification: Transforming Data into Sound

Definition and Rationale
Sonification involves mapping numerical data or other abstract information to audible properties such as pitch, volume, rhythm, or timbre. Its fundamental goal is to leverage the human auditory system’s sensitivity to changes in frequency and amplitude. This can be particularly useful when data contains temporal patterns or fluctuations that might be more readily perceived through sound than sight.

  • Time-Based Patterns: For datasets that evolve rapidly, detecting a small uptick or sudden dip is sometimes easier when it’s rendered as a change in pitch or tempo.
  • Parallel Processing: The brain processes auditory and visual stimuli along different pathways, so combining both channels can help distribute cognitive load.
  • Inclusive Experiences: Individuals with visual impairments or color-vision deficiencies can gain richer insights by “listening” to data, reducing reliance on purely visual cues.
Design Considerations
  1. Data-to-Sound Mapping: Deciding which data variables map to pitch, volume, or rhythmic patterns is crucial. Overly complex mappings can overwhelm users, while oversimplified mappings might convey only superficial insights.
  2. Contextual Meaning: Providing brief textual or spoken labels can clarify what changes in pitch or tempo signify, helping users build intuitive mental models.
  3. Avoiding Auditory Overload: Continuous, intense auditory cues can be fatiguing. Subtle sound cues or situational “alerts” (playing a specific note only when a threshold is crossed) often strike a better balance.

https://www.loudnumbers.net
https://datasonifyer.de/en/
https://science.nasa.gov/mission/hubble/multimedia/sonifications/


Tactile Interfaces: Feeling the Data

Definition and Applications
Tactile interfaces, often called haptic interfaces, communicate information through the sense of touch—vibrations, pressure, temperature changes, or textural shifts. This approach is notably valuable for individuals with visual or auditory impairments, but it also holds potential for creating richer, more immersive data experiences for all users.

  • Vibrotactile Feedback: Short pulses or vibration patterns can indicate specific data thresholds or events, such as crossing a predefined limit or detecting an anomaly.
  • Physical or 3D Representations: Tactile data displays can take the form of raised surfaces, 3D-printed graphs, or shape-changing interfaces. Users can literally feel the peaks, troughs, or relationships in data.
  • Thermal or Pressure Feedback: Emerging technologies allow for subtle temperature changes or pneumatic feedback. For instance, temperature gradients might mirror climate data, enabling users to “feel” environmental shifts over time.
Design Considerations

Integration with Other Senses: Tactile interfaces often work best with visual or auditory cues. Each modality can reinforce or clarify the other, fostering a more complete understanding of the data.

Tactile Resolution: Human touch has limits in distinguishing small differences in vibration frequency or texture. Designers must tailor the granularity of feedback to what users can reliably perceive.

Attention and Comfort: Continuous or intense haptic signals can lead to sensory fatigue. Designers should consider using event-based or gentle transitions to avoid discomfort.


Connecting Sensory Design and Accessibility

The overarching theme linking these ideas is that designing for accessibility often creates a more inclusive, engaging experience for everyone. This approach demands thoughtful consideration of how data is conveyed: beyond color and labels, it involves weaving together sight, sound, and touch. Whether in assistive technologies, artistic installations, or everyday data dashboards, a multisensory perspective can expand what is possible in data communication.