SOUND DESIGN METHODOLOGY

The motivation of using different methodes to do the sound design for this surf movie comes from a lack of surf movies and documentaries that use sound design based on field recordings in this area. With this project I want to showcase how many layers of realness can be added to a surf documentary by using on set field recordings paired with sensor data to convey this experience of surfing on a much deeper level. 
Therefore, the Sound design of this project is not seen as a post-processing effect but as an integral part of how motion and environmental interaction are perceived. The core idea and mission is to treat the surfer’s movement as a gestural performance and dance that modulates audio based on what is actually happening in the image. With the help of Pure Data, a modular synthesis environment, the motion data is mapped on audio processing parameters to underline this immersive and expressive sonic storyline.

Starting with the different sound design inputs that will be used in the Surf film, the primary audio material comes from a contact microphone imbedded in the surfboard. These are real, physical vibrations, bumps, hits, and subtle board resonances create the basic sonic texture of the piece. These raw recordings are used as:

  • Input for audio modulation
  • Triggers or modulating sources for effects like pitch shifting, filtering, and delay

Second core sound source is the Zoom H4n recorder mounted on the nose of the board. Here the focus lies strongly on field recordings in order to capture the raw sonic experience of the surf session. 
Furthermore, the data of the sensor will be adjusting the soundscape, translating raw data into modulation for sound design. 
Also, the internal audio of the GoPro Hero3 will be used to synchronize data in post processing and the recorded video will be a visual representation of the full experience.  

Looking at the mapping part of the project, the x-IMU3 sensor provides multiple streams of data like acceleration, gyroscopic rotation, and orientation, that are mapped to sound parameters. Each data of movement is used differently:

Acceleration (X, Y, Z) modulates filter cutoff, grain density, or reverb size. Here the exact usage of modulation parameters will be discussed in the postproduction phase of the project. 

Angular velocity controls pitch shift, stereo panning, or feedback loops. 

Orientation (Euler angles or quaternion) is used to gate effects or trigger events based on the recorded movement thresholds.

The mappings will be adjusted in the following process and are designed to reflect the physical sensation of surfing in the most accurate way possible. Looking at the movement that is most important, the Cutback move, here a sharp move will translate in a spike in angular velocity. This spike can be translated in a big glitch sound effect. Here more research and test will be needed in order to find the best parameter settings for this modulation. 

One possibility of audio modulation in Pure Data will be the granular synthesis. It allows to create evolving textures from short segments, like grain noise of the recorded contact mic sounds. 
Further examples of possible modulations: 

  • Grain size – (short = more textural, long = more tonal)
  • Playback speed and pitch
  • Density and overlap of grains

Looking at the storyline of the surf documentary one can pinpoint the following narrative structure of the sound design: 
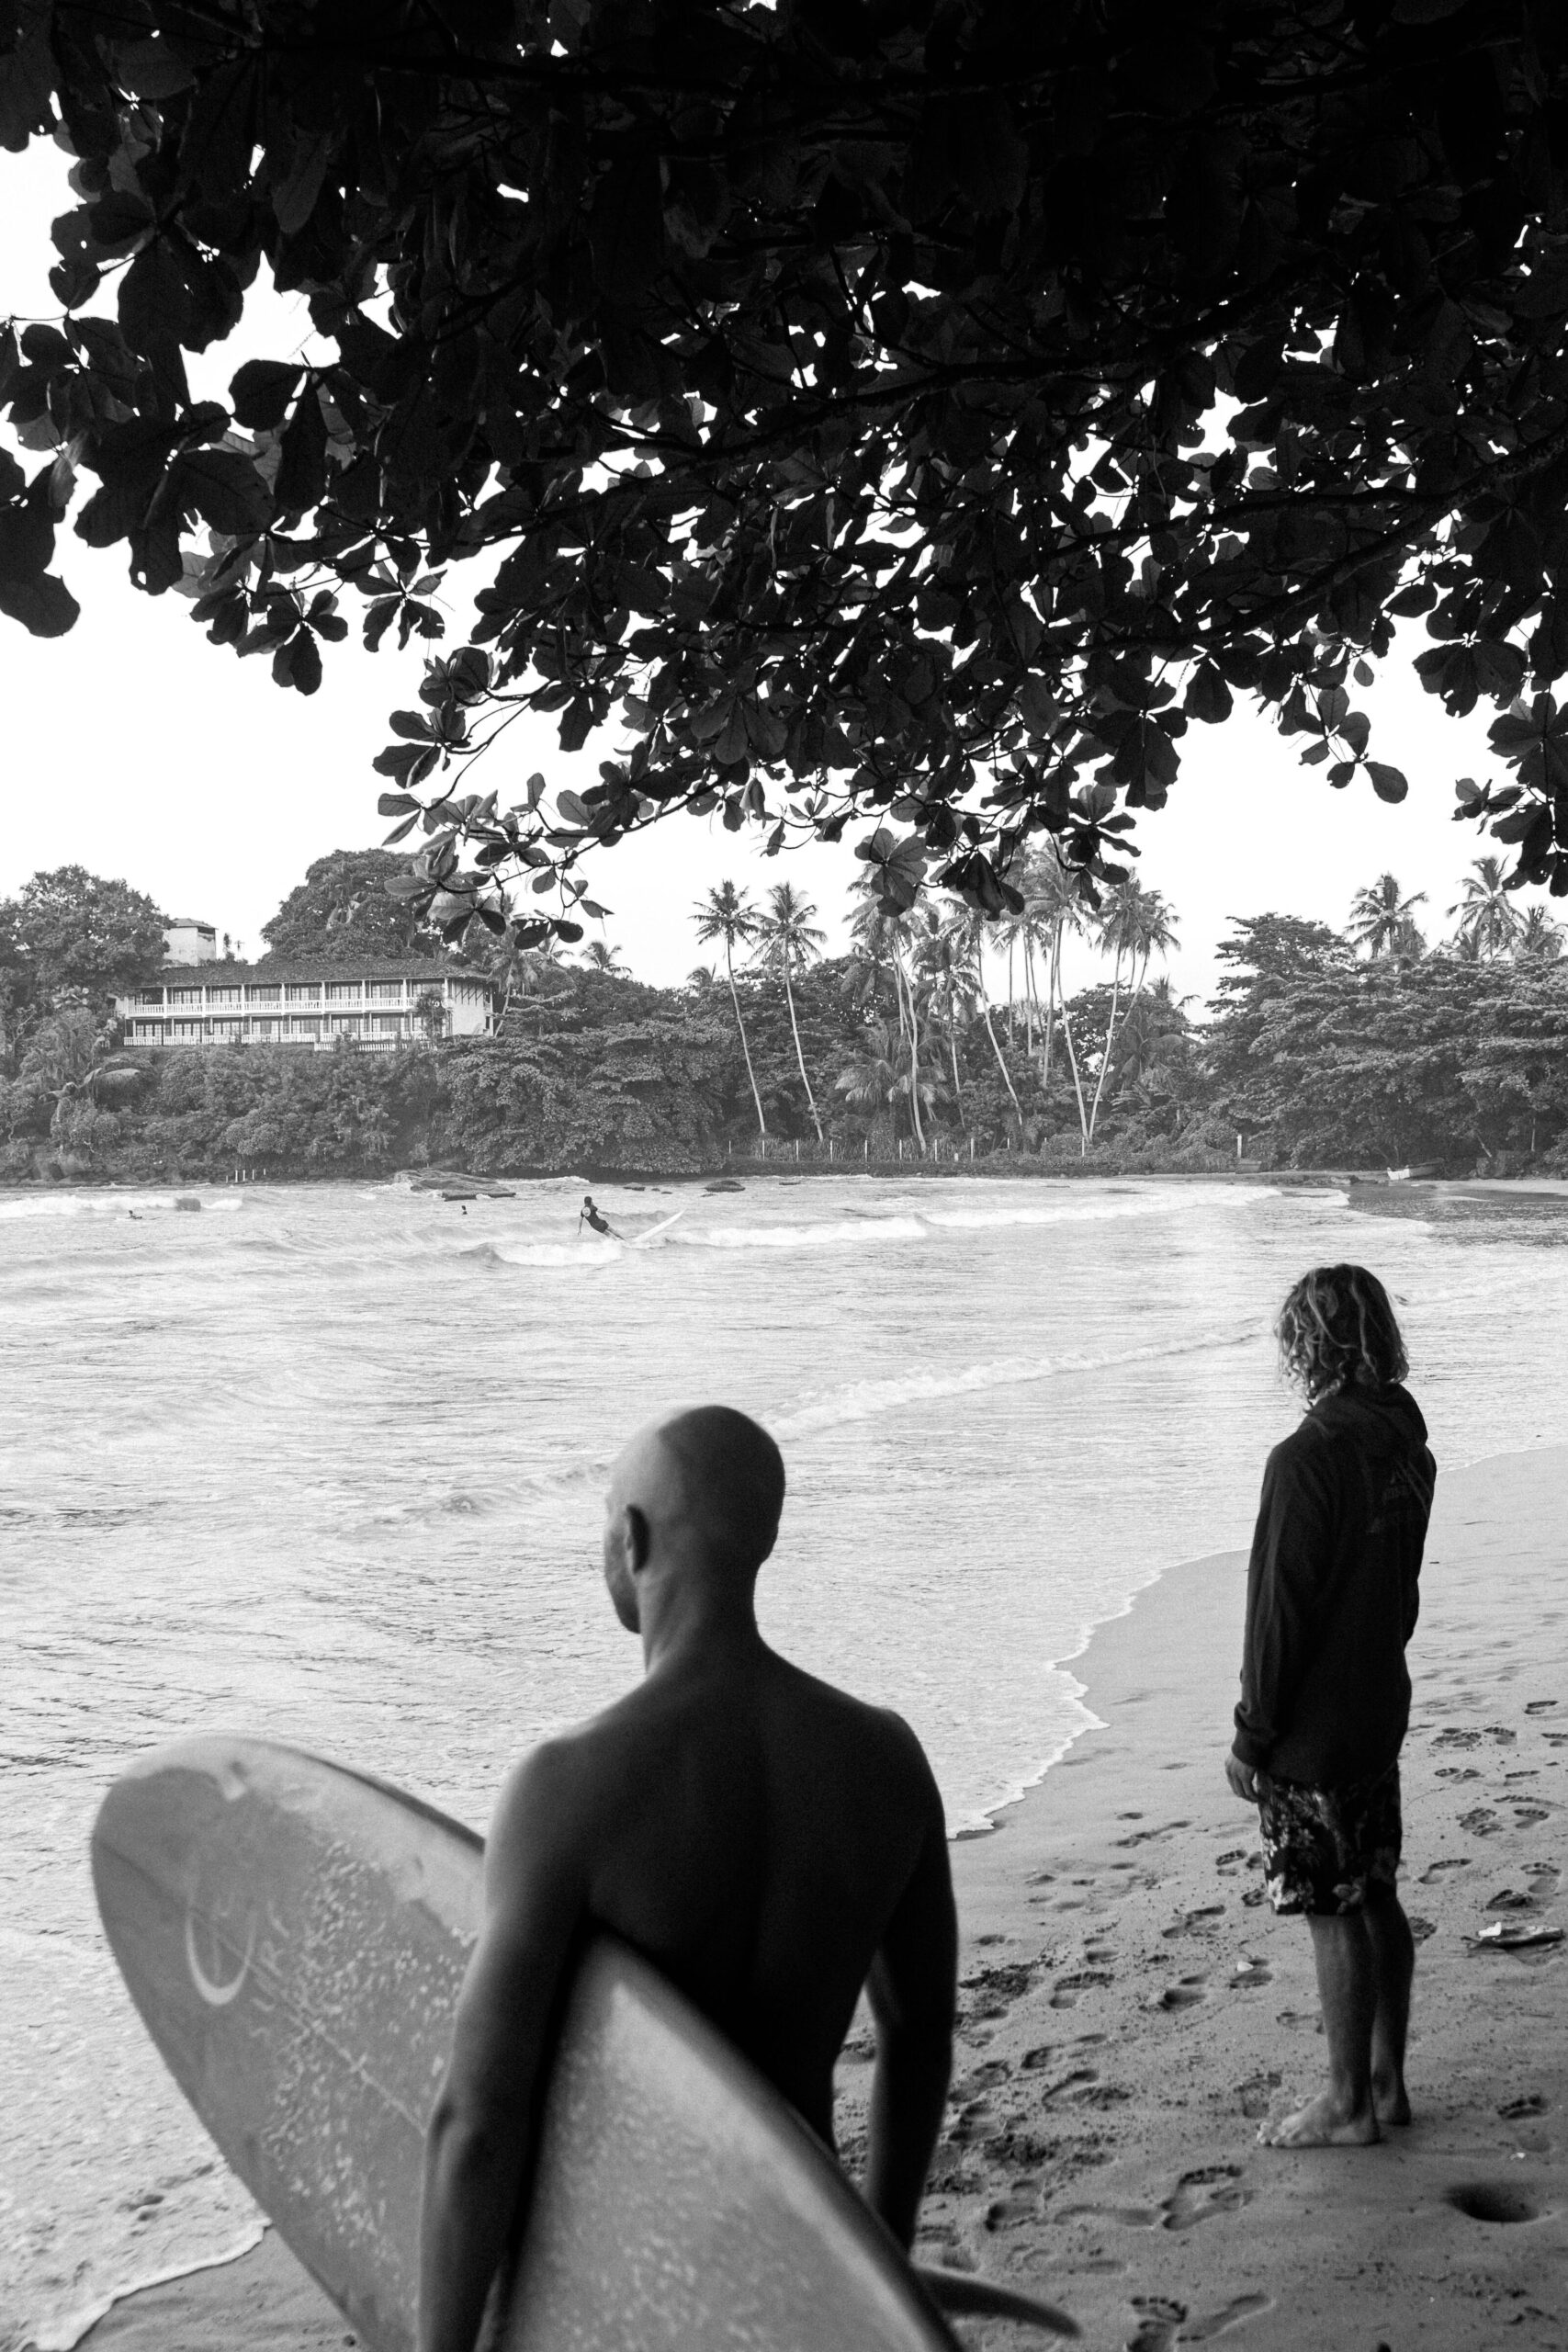
Before the surf / coastline of Morocco

To catch the stressful coastal live of Morocco field recordings will be used to translate this feeling of stress, being overwhelmed (red mind).  Here the recordings will be done by the Zoom H4n recorder. 

Entering the water/ Paddling Phase

As the surfer enters the water the stressful coastal sounds fade, and the listener will be surrounded by the sound of the ocean. Here it is important to translate the soundscape, which the surfer actually perceives. No further sound modulation is added here. The theory of the blue mind points out how much the noise of the ocean can regulate the nervous system. This will be translated to the sound design of this section of the movie, giving the listener the feeling of being in the present. 

Catching the wave

As soon as the surfer catches the wave and manages to stand up on the wave the dramaturgical main part of the composition begins. This will be initialized by a strong impact on the contact microphone, triggered by the jump of the person. This will also be measurable on the motion sensor with increase of speed. At this point of the composition the sound modulation starts. 

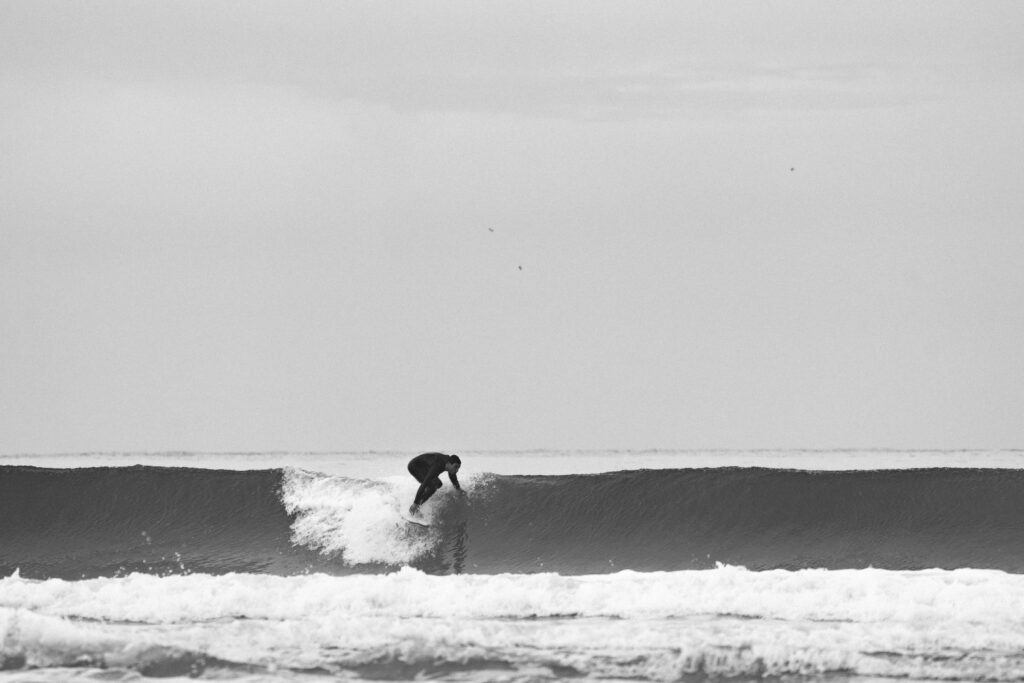
Riding the wave / Cutbacks: At this stage of the movie the person feels a sensation of absolute presence and high focus. This natural high state gives a feeling that is hardly describable in words or images. Here the Sound Desing carries the listener through. Granular synthesis, stereo modulation and filtered resonance reflecting the physical and spiritual intensity in this moment. Here the tool of sound modulation is chosen intentionally to also create a contrast between the paddling stage of the movie.
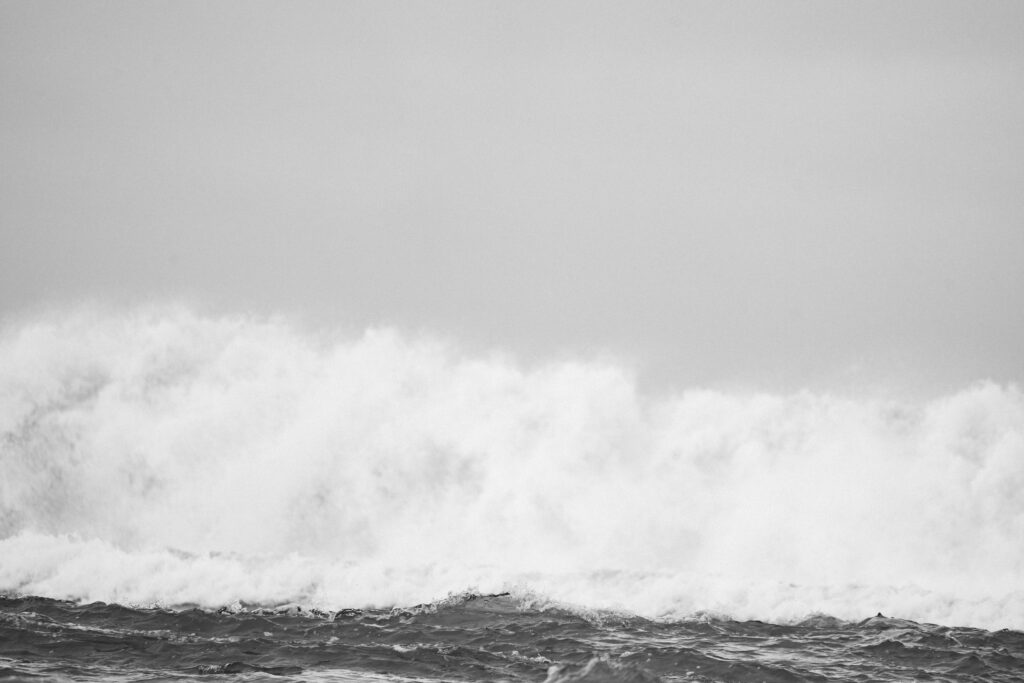
End of the riding / Hit of the wave

In the end of the movie the surfer will fall in the water creating a strong and impactful ending of the whole experience. This sudden cut will be auditory through a big amount of noise of the underwater recording. Nothing more than muffled wave sounds will be heard to empathize the feeling of being underwater. Sonic textures will decay leaving with a feeling of stillness after this intense movement. 

With the help of this sonic structure both the physical and emotional journey of a surf session is captured and represented.

Considering the final sound piece a stereo format is the first output. Also including spatial depth will be achieved through modulation and stereo imaging based on the recorded motion data. Volume normalization and dynamic range control are applied in Davinci Resolve, however by respecting the intention of the sound piece to add less additional audio modulation by a software and only using techniques of audio manipulation using the sensory data. 

The final audio and movie is intended for headphone or multichannel playback in an installations or possible surf exhibitions.

Playback and Visualization of x-IMU3 Sensor Data Using Python and Pure Data

Moving forward, in this section the documentation of the workflow used to playback recorded x-IMU3 motion sensor data and visualize it as a dynamic graph in Pure Data, is shown. The goal here was to analyze the movement of two specific flips along the X-axis. Therefore a few seconds of this rotation were recorded and then read through the python script, send to PureData and here printed in a visual graph. The confirmation of the accuracy was done through multiple validation layers.

First, data was captured using the x-IMU3 inertial measurement unit. During the recorded session, the sensor was physically maneuvered to do two flips along its X-axis. Then, this data was saved internally by the sensor into a binary format with the extension. ximu3. In order to later find this file again, it was named XIMUA_0005.ximu3 and was stored on an external drive.

Second step was to decode and transmit the recorded motion data. Therefore, I used a Python script named ximu2osc.py. This script was written to read both live and recorded data and transmit it via the Open Sound Control (OSC) protocol. This python script uses the official ximu3 Python library to do file decoding, and the python-osc library for sending OSC messages.

The python script was executed using the following command in the terminal:

Using this script the playback of the sensor recording get initialized by naming the .ximu3 file as input. Looking at the command, the -p argument sets the OSC port to 9000. The -H argument points out the destination IP address, which in this case is 127.0.0.1. The Python script, in the next step, reads and decodes the binary sensor data in real time. Next step, the formatted OSC messages gets send using a clearly defined path.

Focusing on the receiving end, a Pure Data (Pd) patch was created to receive and interpret the data. This patch was configured to listen on port 9000 and processes the incoming OSC messages with the [netreceive -u -b 9000] object. It is capable of receiving UDP packets in binary format. The output from netreceive was then connected into [oscparse] object. OSCPARSE is responsible for decoding incoming OSC messages into usable Pd lists.

[list trim] was introduced in the patch to remove any resisting selectors. As the next step, a set of [route] objects were implemented. There were placed to filter out the gyroscope data, specifically the values from the X, Y, and Z axes. In this process a hierarchical routing structure was used. The first one: [route intertial], followed by [route gyroscope] and finally [route xyz]. The final values were then unpacked using [unpack f f f] to split them into three float values (X, Y, Z). For this test, only the X-axis values were needed.

To have a visual representation of the X-axis values in real time, an array named array1 was created. It functions as a scrolling plot reading the incoming rotation data. This was executed by assigning each X value to a new index in the array [tabwrite array1]. A simple counter system was built using [metro] to write the position in the array. [+ 1], [mod 500]. The [metro] object gets triggered at a 500ms interval, which, in this case served as the sampling rate of the graph. This counter also loops over a fixed range of 500 steps. This is how the circular buffer was build. Now, each new value is being stored in a float object [f] and sent via [s x-index] to its matching [r x-index].

A screenshot of a computer

AI-generated content may be incorrect.

With using this setup, it is possible to visually plot the continuous stream of X-axis values into the array. The result is a dynamic visualization of the sensor’s movement over time. Looking at the playback of the recorded. ximu3 file, the two flips performed on the X-axis are strongly stown as spikes in the plotted graph. This provides a real representation of the motion of the flip along the X-axis. In addition, all values were also printed to the Pd console in order to verify and debugging purposes.

Next step, to ensure the accuracy of the visualization, I compared the received values in three different ways. First, I monitored the terminal output of the Python script. Here every OSC message that was being sent was printed out, including its path and its matching values. Secondly, I checked the values listed inside Pure Data. Here the numbers were compared with the one from the terminal. Thirdly, I opened the. ximu3 file in the official x-IMU3 GUI and therefore exported the data as a CSV file. Analyzing the resulting file Inertial.csv, the “Gyroscope X (deg/s)” column was detected and housing the same values then printed in the terminal, in Pure Data and visually on the graph. This lets me confirm, that the sensor data was transmitted consistently across all three layers: the original file, the terminal stream, and in the end, the Pd visualization.

In conclusion, this test showcasts a successful connection between recorded sensor movement and its visual representation using an OSC streaming data pipeline. A clearly structured, repeatable method was used to analyze a specific gestures or physical event, recorded by the sensor. Furthermore, the system is adaptive and can be easily adjusted to visualize different values. It also sets the ground stone for other possibilities in sound design and audio adjustment in the further process.

Using x-IMU3 Python API for Live USB Data

In addition to decoding files using the x-IMU3 GUI, this project also focuses on utilized the Python library provided by x-io Technologies. Here sensor data can be streamed directly from the device via an USB connection. After successfully installing the ximu3 package with pip3 install ximu3, the provided example scripts of the GitHub repository’s Examples/Python were being used. In particular the usb_connection.py. (https://github.com/xioTechnologies/x-IMU3-Software) In the next step, after installing the ximu3 Python package via pip3 install ximu3, the script usb_connection.py was located and run from the external SSD directory /Volumes/Extreme SSD/surfboard/usbConnection.

To execute the script, the following terminal command was used:
   python3 /Volumes/Extreme\ SSD/surfboard/usbConnection/usb_connection.py

The next step is successfully executed once the x-IMU3 is detected. Here the user is prompted whether to print data messages or not. After enabling this, the terminal now displays live sensor data. This data set includes quaternions, Euler angles, gyroscope, and accelerometer data. It is noticeable, that this method bypasses the GUI and provides a direct access to sensor streams. This step enables a more flexible integration and a more advanced data mapping setup.

The full Python architecture includes modular scripts like connection.py, usb_connection.py, and helpers.py. These are handling low-level serial communication and parsing. This additional access pathway expands the projects versatility and opens doors for a more experimental workflow (x-io Technologies, 2024).

  1.  OSC Data Interpretation in Pure Data

The received OSC data is interpreted using a custom Pure Data patch (imu3neuerversuch22.04..pd), which serves as a bridge between sensor data and visual representation of the data. This patch listens for incoming OSC messages via the [udpreceive] and [unpackOSC] objects, parsing them into sub-addresses like /imu3/euler, /imu3/acceleration, and /imu3/gyroscope.

Each of these OSC paths carries a list of float values, which are unpacked using [unpack f f f] objects. The resulting individual sensor dimensions (e.g., x, y, z) are then routed to various subpatches or modules. Inside these subpatches, the values are scaled and normalized to fit the intended modulation range. For example:

  • Euler angles are converted into degrees and used to modulate stereo panning or spatial delay.
  • Z-axis acceleration is used as a trigger threshold to initiate playback or synthesis grains.
  • Gyroscope rotation values modulate parameters like filter cutoff or reverb depth.

Additionally, [select] and [expr] objects are used to create logic conditions, such as identifying sudden peaks or transitions. This setup allows the system to treat physical gestures on the surfboard—like standing, carving, or jumping—as expressive control inputs for audio transformation.

The modular structure of the patch enables quick expansion. New OSC paths can be added, and new sound modules can be integrated without rewriting the core logic. By structuring the patch in this way, it remains both maintainable and flexible, supporting future extensions such as machine learning-based gesture classification or live improvisation scenarios.

This technical design reflects a broader trend in contemporary media art, where real-world data is used not just for visualization but as a means to dynamically sculpt immersive audio experiences (Puckette, 2007).