Throughout the process of writing the past blogposts, researching the topic of loneliness and connection and just generally moving along in the masters degree I’ve decided to change directions a bit in terms of my topic and approach to the thesis. While I still find it really interesting how human connection is formed, why we’re lonely, how this can be dealt with and what role interaction design can play in all this, I want to take a look at other topics that have peaked my interest. What I’ve found myself always coming back to in recent months are interfaces and interface design, especially tangible interfaces and multi sensory or haptic displays that challenge the increasing use of screens that has been happening over the past few years. I have identified three topics connected to this interest that I would like to take a closer look at.
Tangible interfaces & education Like I said I’m especially interested in how I could design interfaces that are more physical, less screen-based (more touch, movement, play, spaces etc.). What I would mostly want to look at is how these interfaces could make abstract or complex concepts more understandable. One context I’m interested in is science (education), not through a textbook, but through interactive, embodied experiences that help people grasp things like time, scale, systems, or cause-and-effect in a hands-on way. This could be interesting for museums or learning spaces for children. A first prototype here could be a very simple, tactile experiment to translate a scientific concept into a physical interaction, something you can touch or manipulate and therefore understand in a more meaningful way.
Material engagement & making Another topic I want to explore is the value of making things with our hands in an increasingly digital world. How can interaction design support or encourage craft, manual skill, and material engagement? OR how can interacting through physical craft and creation support our mental health? I’m interested in the psychology behind this: how slowing down, working with tools or materials, or creating something by hand can support well-being or mental clarity. Interesting keywords here are play theory, flow theory, and the mental health benefits of active engagement. I wonder: what would a design look like that invites people to slow down and focus through physical making? Could “inconvenience” be a design goal in a positive sense (This is something I also discussed in my Glitch-Workshop during international design week)? A project here might be a simplified or slower interface that’s not as efficient or powerful as for example a phone, but rather something that rewards mindfulness and encourages active engagement and slowing down.
The future of communication & interaction A third idea floating around in my head is about the future of communication technologies. Specifically: how can we design new ways of interacting with one another that support connection, but without the overwhelming side effects of today’s always-online, screen-heavy tech? I could explore how technology can be designed to be meaningful and less distracting. Maybe more ambient, multi-sensoric, or embodied communication? I don’t know yet how to prototype this or exactly what type of project this could lead to, but even diving into different types of communication and how we use them (screen-based/digital vs. physical, synchronous vs. asynchronous, passive vs. active) could help me define where to design. This is something I already partly touched upon during my bachelors thesis and found very interesting, especially since there is quite a bit of research but not too many innovative solutions.
The next challenge is figuring out how to structure my exploration from here. I think I’ll use the next few blogposts to dive deeper into each of these themes. I’m still unsure what the final prototype might be (an educational tool, a communication medium, or a kind of interactive craft) but I’m hoping that following these ideas will help me arrive at something more concrete and meaningful.
Below are the four participants whose heart-rate-variability traces we have explored. We deliberately chose them because they sit at clearly different points on the “health–illness” spectrum and therefore give us a compact but vivid physiological palette.
Subject 119 is our practical baseline. No cardiac findings, no anxiety-or-depression scores, no PTSD, no “Type-D” personality pattern. Anything we hear or see in this person’s HRV should approximate the dynamics of an uncomplicated, resilient autonomic system.
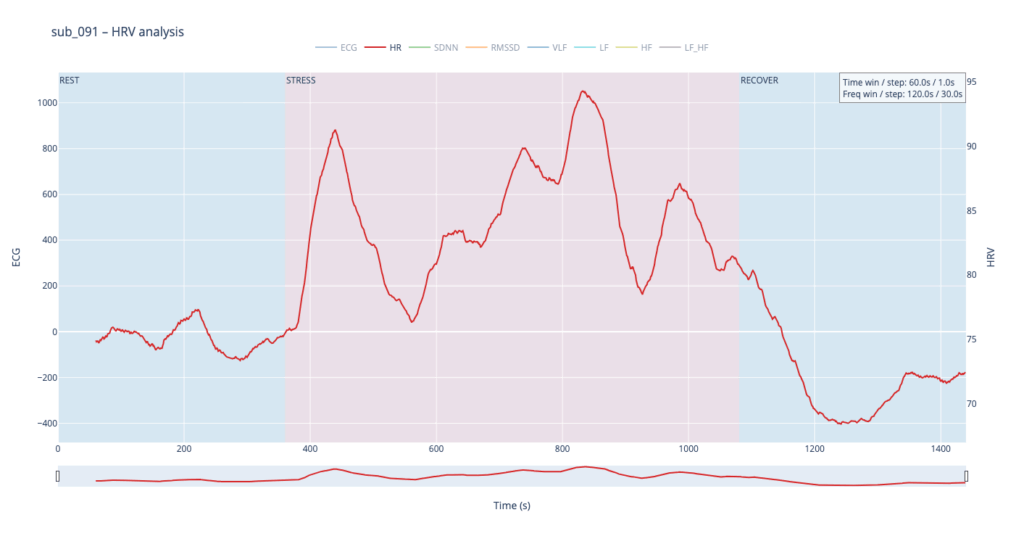
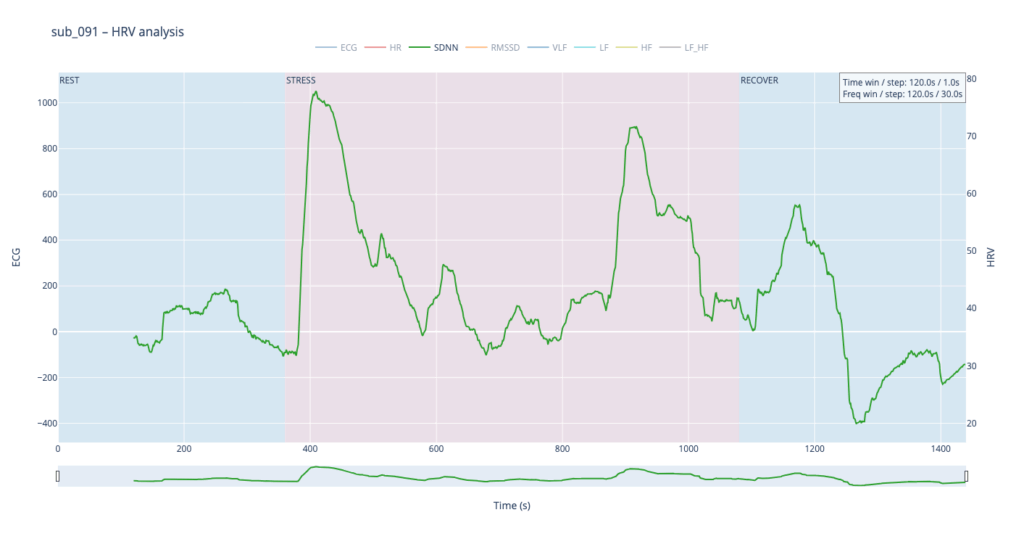
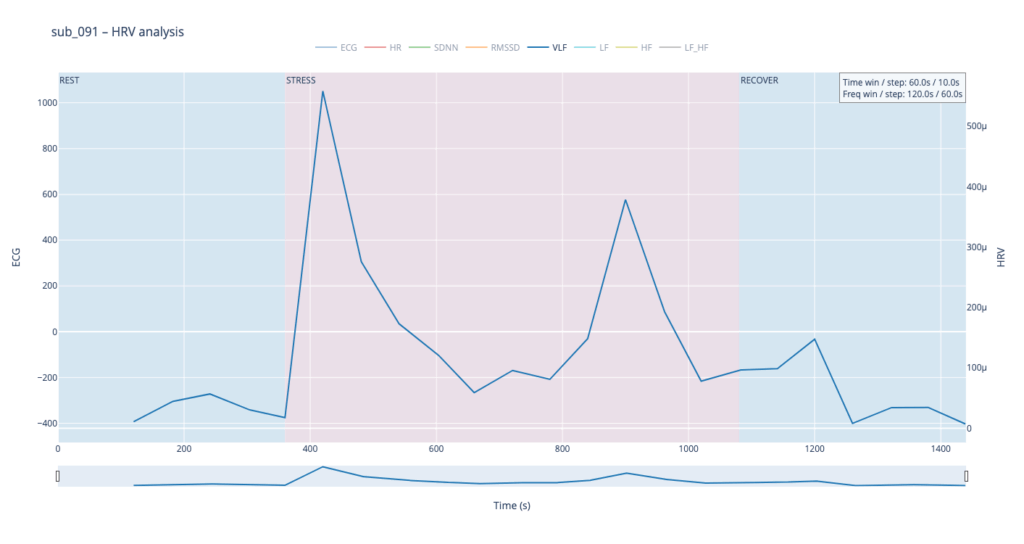
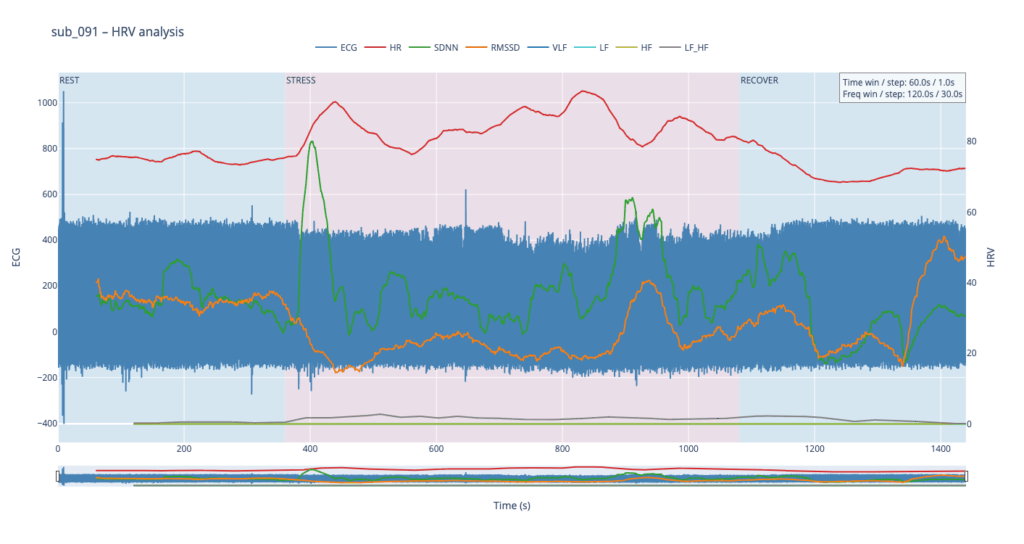
Subject 091 represents a “mind-only” disturbance. The heart itself is structurally sound, but the person carries the so-called Type-D trait (high negative affect, high social inhibition). This makes the autonomic system more reactive to worry or rumination even when the coronary vessels are normal.
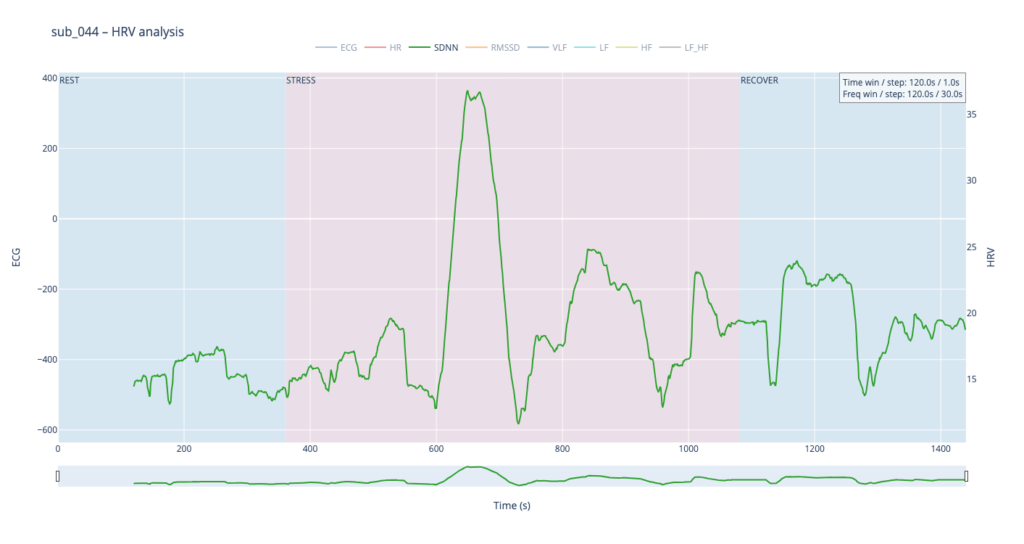
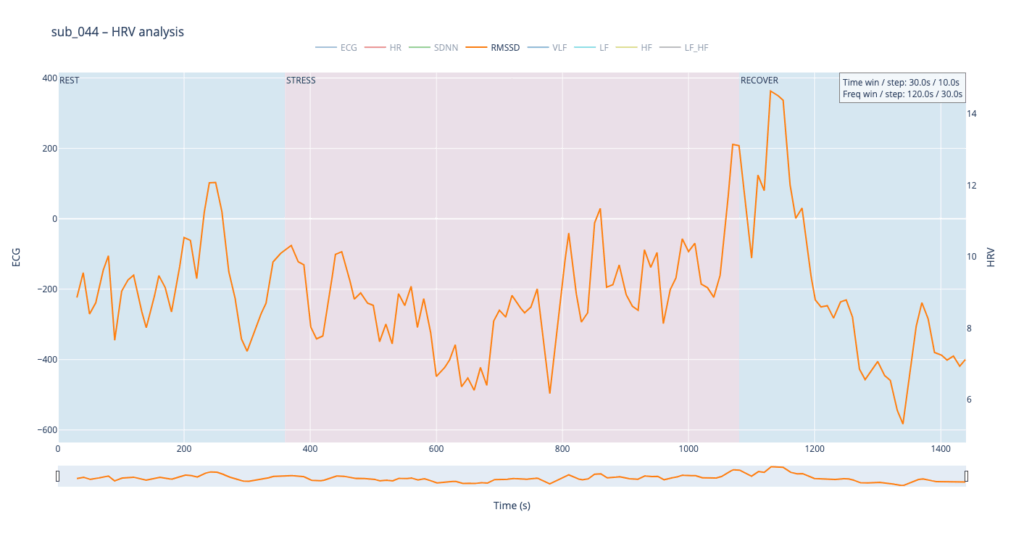
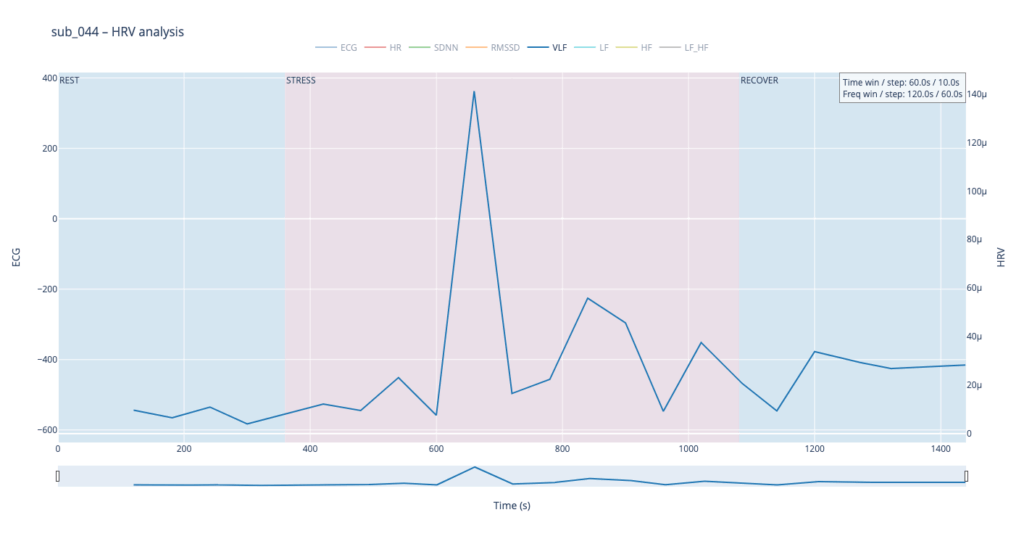
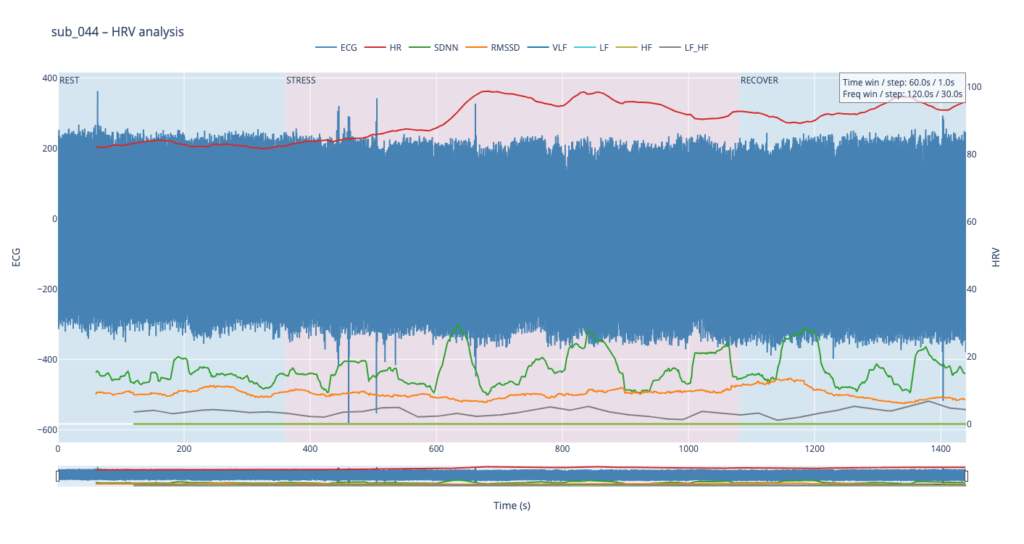
Subject 044 adds psychological trauma on top of mild, non-obstructive angina. Clinically this participant scores high on anxiety and meets full PTSD criteria. We therefore expect brisk sympathetic surges, slower vagal recovery and more noise in the LF/HF ratio—an autonomic pattern often seen in hyper-arousal states.
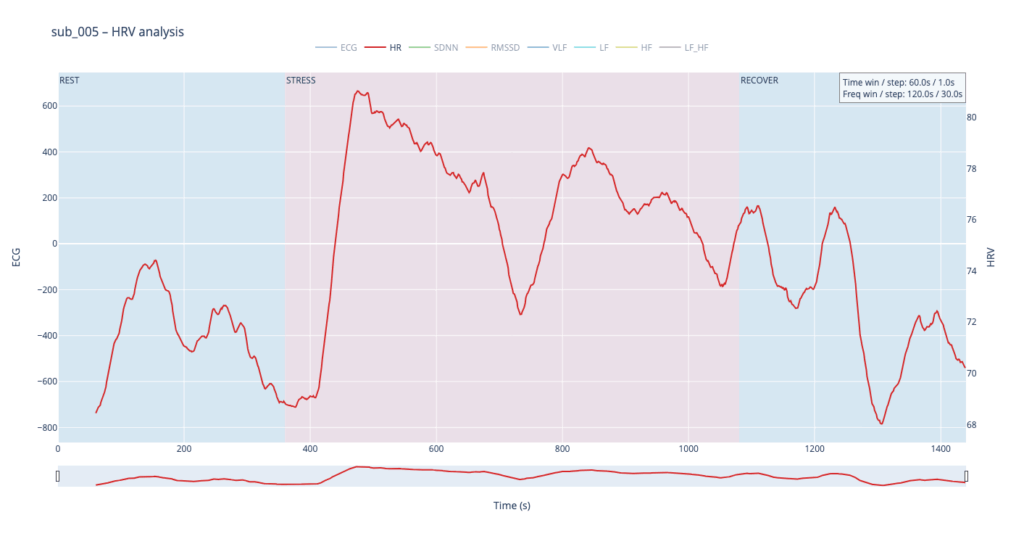
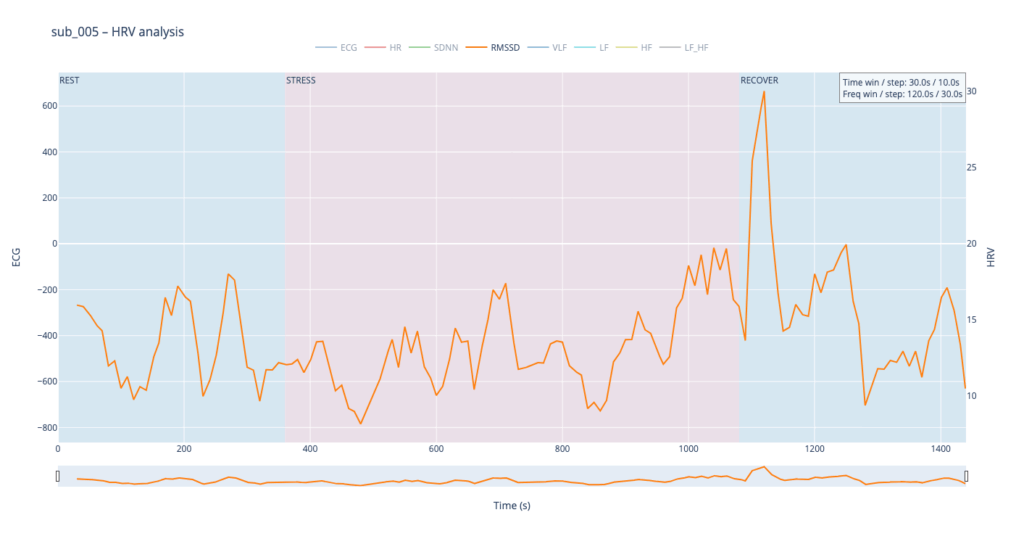
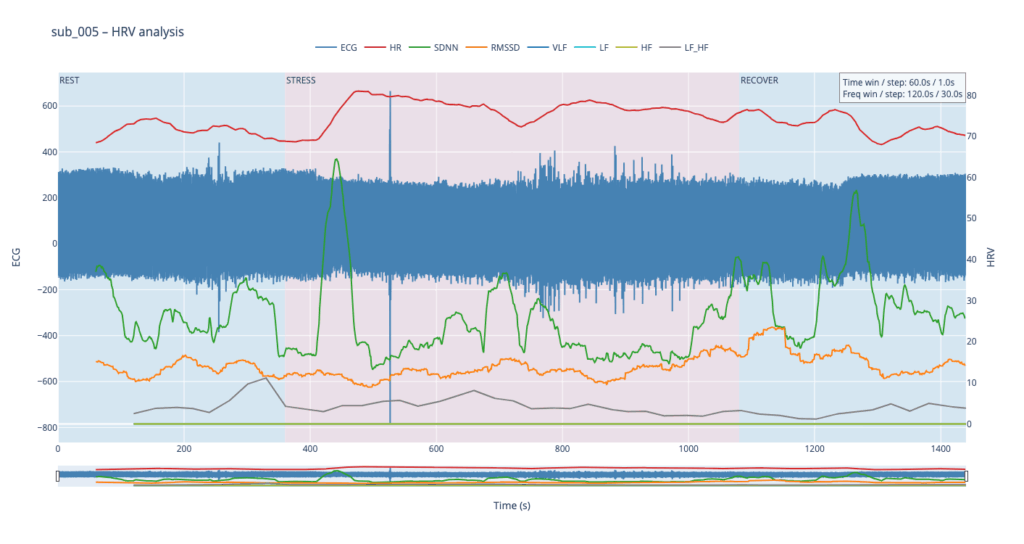
Subject 005 is the most medically burdened case: non-obstructive angina, endothelial dysfunction, stress-induced ischaemia, plus anxiety, depression, Type-D personality and PTSD. In short, both the mechanical pump and the emotional “software” are under strain, so variability measures are likely compressed and heart-rate plateaus may appear where a healthy person would fluctuate.
Using these four contrasting bodies as our “voices” lets us investigate how the same 6-min rest → 12-min exercise → 6-min recovery protocol is translated into four distinct autonomic narratives—information we will later map into equally distinct sonic textures.
HR
In general, each cardiovascular system answers physical load differently, depending on the baseline autonomic tone, fitness, psychological state, and comorbidities.
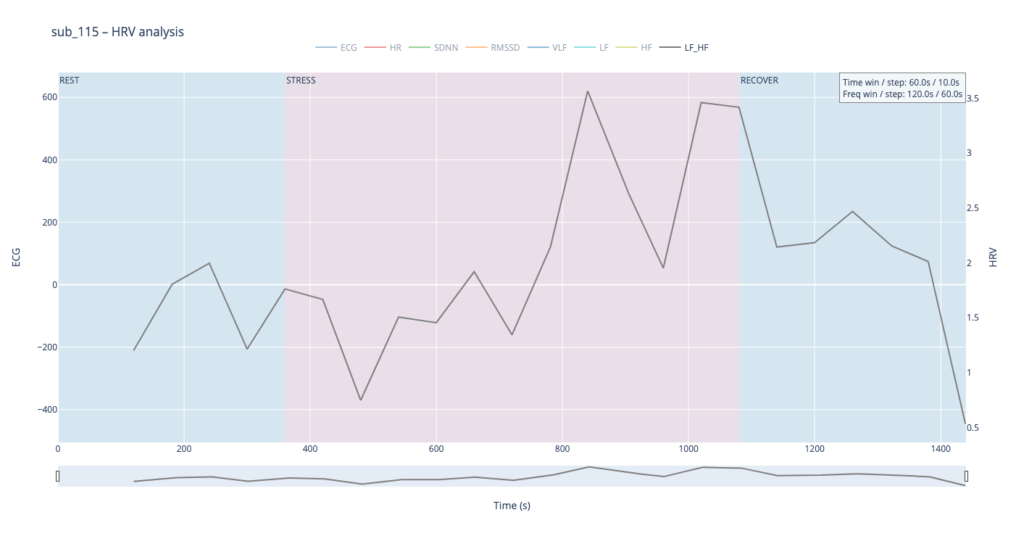
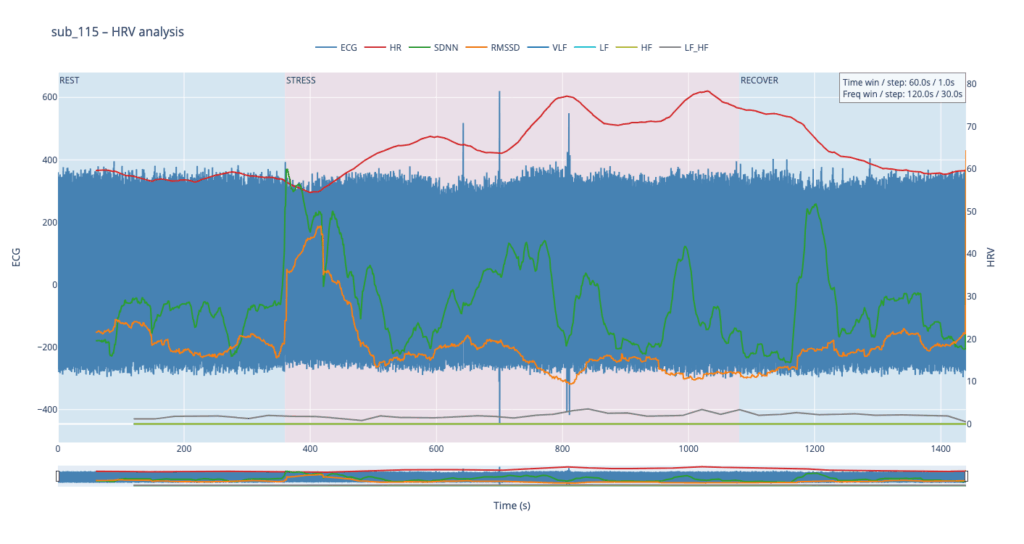
sub 115 – “healthy” The heart “ramps up” slowly. Pulse climbs in stair-like steps with brief dips between peaks—the body is constantly trying to regain homeostasis. After the exercise HR quickly falls almost to baseline. This is typical of a well-trained, adaptive cardiovascular system with a large functional reserve.
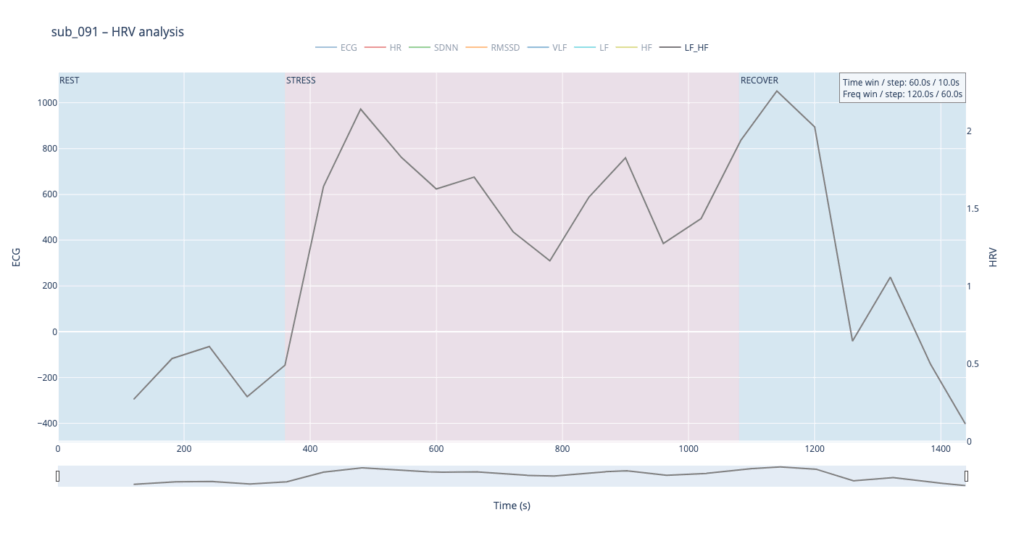
sub 091 – “mental / Type D” Resting HR is slightly above normal, yet overt anxiety is absent. The response is inertial: about a minute after load starts HR jumps from 75 → 91 bpm, then plummets to 76, followed by alternating short rises and falls. When the exercise stops, HR drops to 68 (below the initial value) and only then drifts back to ~75. Such a “swing” may reflect conflicting sympathetic vs. parasympathetic signals: outward calm while inner tension builds and discharges in bursts.
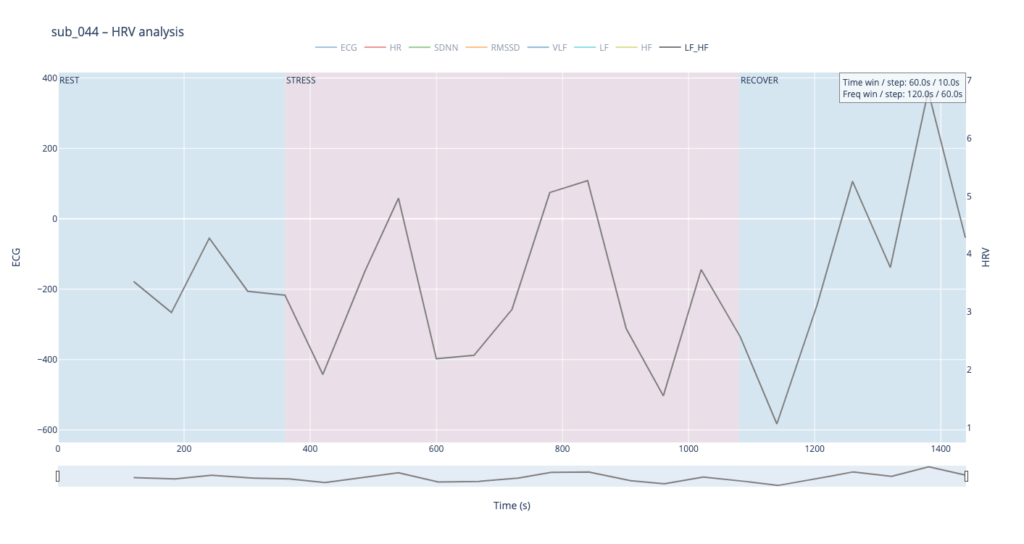
sub 044 – “PTSD” Even before load the heart is already in “fight-or-flight” mode (~83 bpm). The onset of exercise changes little, but at the third minute HR spikes to 98. It then declines stepwise yet remains high (89–97) even during recovery. The absence of a deep post-exercise dip shows that the parasympathetic “brake” hardly engages— the body struggles to shift into a resting state.
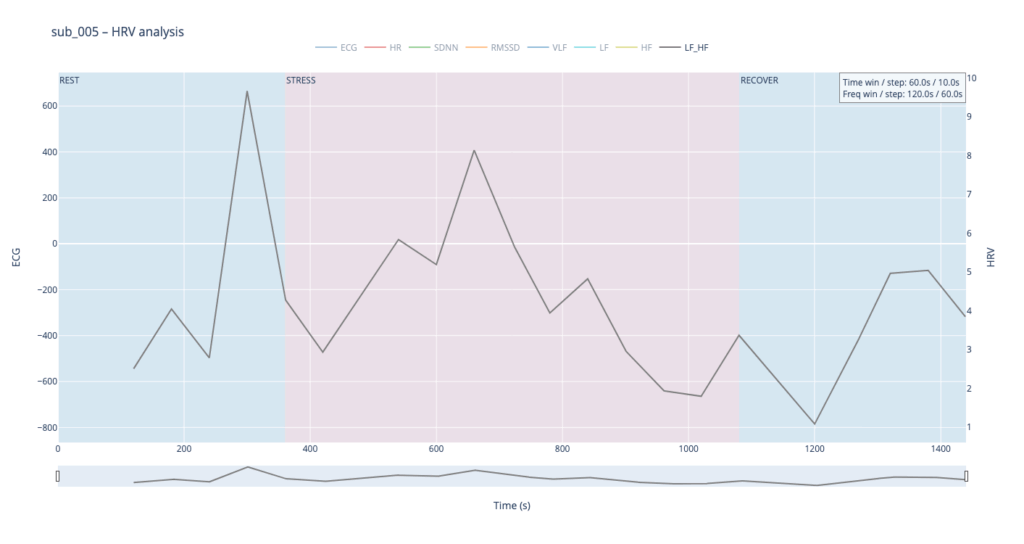
sub 005 – “sick / multiple pathologies” Baseline HR is 68. At the start of exercise it leaps to 80, after which it very slowly, step-by-step, drifts back toward normal and stays there until the end of the trial. The pattern resembles sub 044 but with lower background stress and slightly better recovery.
In healthy subjects the heart rate rises smoothly in step-like waves during effort and quickly settles back to baseline once the task stops, reflecting a well-balanced push-and-pull between sympathetic “accelerator” activity and parasympathetic (vagal) “brakes.” In patients with cardiac disease, PTSD or Type-D traits the resting rate is already elevated, the response to stress is sharper or more erratic, and the return to baseline is sluggish, showing a system locked in chronic “fight-or-flight” with weaker vagal damping.
Sound-design mapping:
Based on HR, I want to create drum patterns, where the lowest HR generates only kick, and then if HR rises, we can add more percusive elements.
SDNN
SDNN tracks how much the RR-intervals expand and shrink over time.
When the value climbs, the spacing between beats becomes more irregular—your heart is “dancing” around the mean to satisfy moment-to-moment demands.
When the value sinks, the intervals line up almost like a metronome—either the organism is in very deep rest or the rhythm is held in a tight sympathetic “clamp” and cannot flex.
Usually this parameter is calculated for 24 hours, but since we dont have such luxury, we stick to 2min time window
Looking at all four traces, the healthy control shows the widest SDNN swing and more frequent surges during the load phase. This wide dynamic range tells us the cardiac pacemaker is quick to loosen and tighten the rhythm, i.e. it adapts smoothly to the body’s changing needs. By contrast, the clinical subjects operate in a narrower corridor: their SDNN rarely strays far from baseline, signalling that the heart either remains compressed by chronic sympathetic tone or cannot recruit enough parasympathetic “slack” to respond fully.
For the sound-mapping layer, I’d like to add a short delay on the Drums track and control athe mount of feedback and reverb of echoes.
RMSSD
RMSSD is conceptually close to SDNN, but it is calculated as the square root of the mean of the squared differences between successive RR intervals. In essence, RMSSD captures beat-to-beat (“breath-by-breath”) variability, whereas SDNN reflects overall dispersion of intervals within the chosen window. Because of this local focus, we processed RMSSD in a shorter analysis window—30 seconds with a 10-second step—to obtain a curve that is smooth yet sensitive to rapid changes.
The comparative analysis reveals patterns similar to SDNN, with several noteworthy differences. First, in the clinical subjects, the RMSSD range is almost twice as narrow, indicating reduced high-frequency variability—the heart is working in a more “rigid” mode. Second, in both pathological cases, RMSSD rises noticeably toward the end of the protocol: once exercise stops, sharp spikes appear that are virtually absent in the healthy subject. This delayed surge suggests a late engagement of parasympathetic control—the body remains under sympathetic drive for a prolonged period and only during recovery tries to compensate, generating erratic, uneven intervals.
To highlight the heart’s “rigidity,” I plan to map RMSSD to the pitch shift of drums.
Spectral HRV analysis
For spectral HRV analysis the gold-standard window is about five minutes, but in this project we need a compromise between scientific reliability and near-real-time responsiveness. We therefore use a 120-second window with a 60-second step.
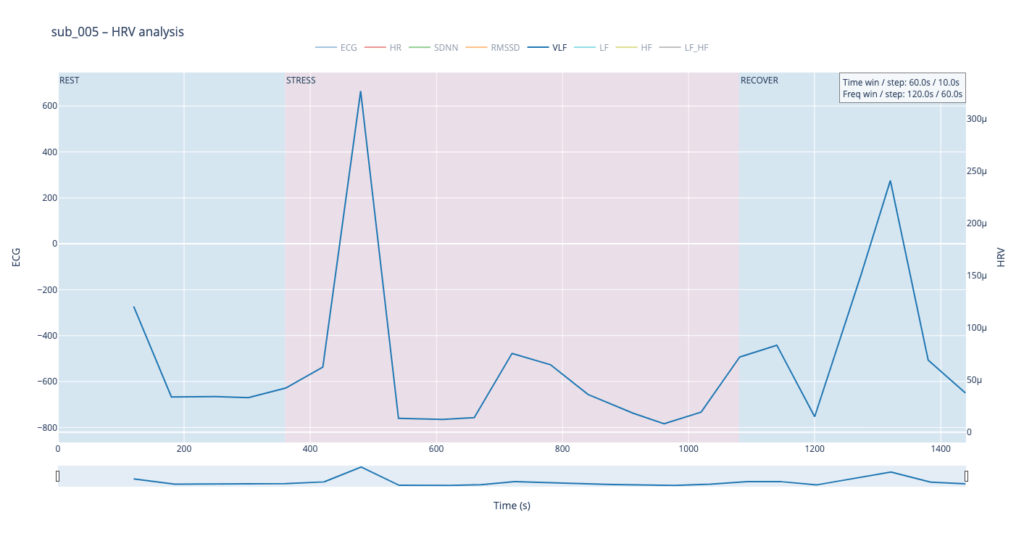
VLF
Within such a short segment, the VLF band (0.003–0.04 Hz)—which is thought to reflect very slow regulatory processes such as hormonal release and thermoregulation—cannot be interpreted with the same statistical confidence as in traditional five-minute blocks. Even so, the plots still reveal that surges in VLF power tend to appear just before rises in heart-rate amplitude. In our context that timing may hint at micro-shifts in core temperature or other slow-acting homeostatic mechanisms that prime the cardiovascular system for the upcoming workload.
VLF → Sub-bass “body boil” layer We will map the slow-acting VLF band to a very low sub-bass drone in the first octave (≈ 30-60 Hz). As VLF power rises the pitch of this bass note is gently shifted upward by a few semitones and a subtle vibrato (slow LFO) is added. The result feels like liquid starting to simmer: higher VLF = hotter “water,” faster wobble, and a slightly higher fundamental. A pre-recorded low-frequency sample (e.g., pitched-down kettle rumble) can sit under the main mix; its playback pitch follows the same VLF curve to reinforce the sensation. When VLF falls, both pitch and vibrato relax, letting the bass settle back to its calm, foundational tone. This approach sonically frames VLF as the deep thermal undercurrent of the body.
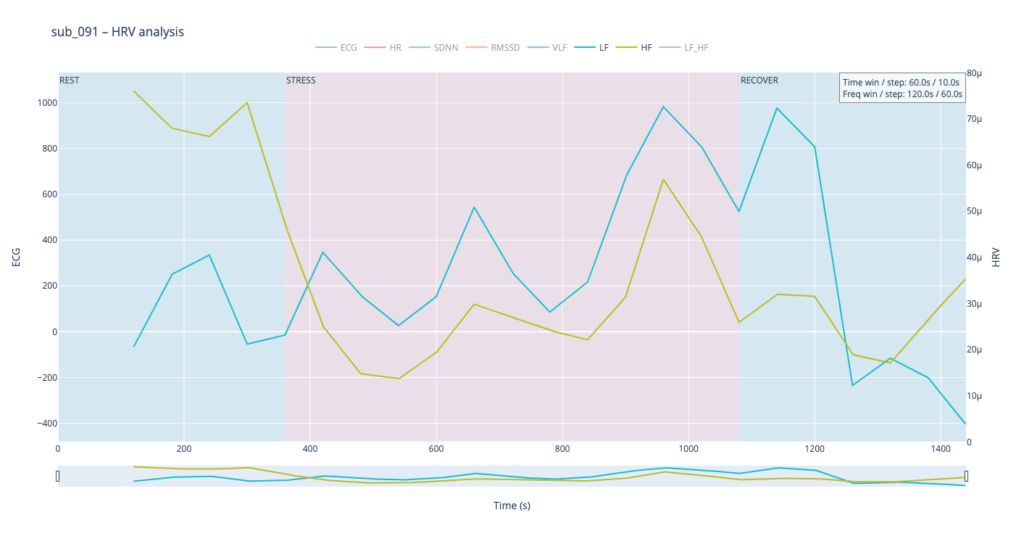
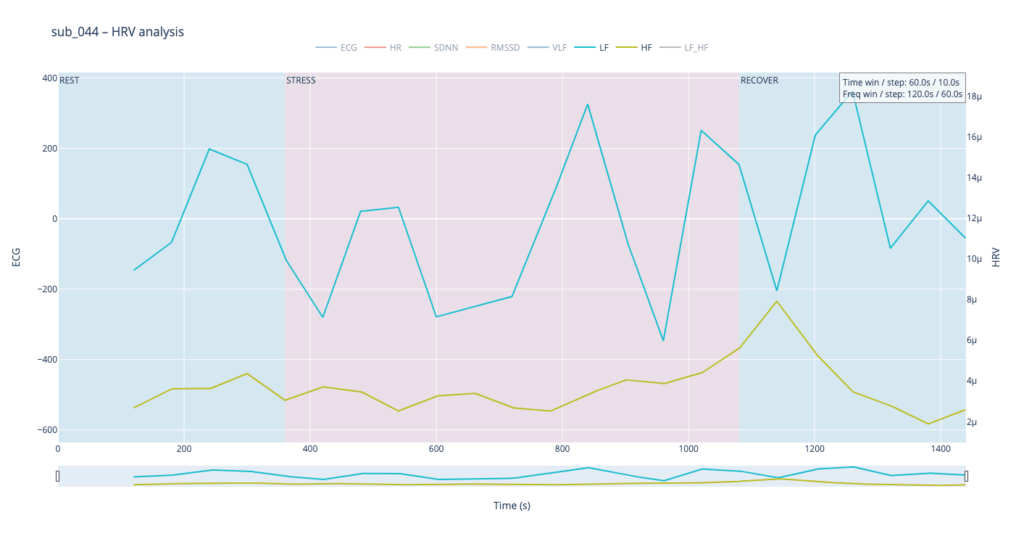
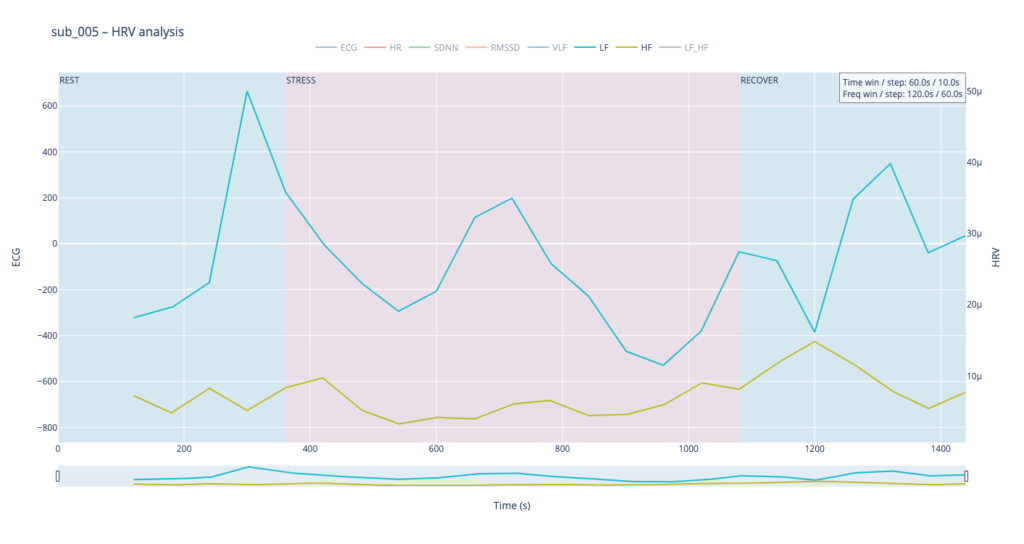
LF & HF
Low-Frequency (LF, 0.04–0.15 Hz) and High-Frequency (HF, 0.15–0.40 Hz) power curves mirror the behavior we already saw with SDNN and RMSSD. That is perfectly logical: SDNN and LF both track activity of the sympathetic branch, which dominates under stress—heart rate accelerates, blood pressure rises, LF climbs. Conversely, HF and RMSSD follow the parasympathetic (“vagal”) branch: as the body relaxes, the heart slows, breathing deepens, and HF increases.
Patient 091 delivers a textbook illustration of that theory. At rest his HF overtops LF, but the moment exercise begins the autonomic balance flips—LF jumps above HF and keeps climbing, whereas HF rises more modestly and then drops back near the end, underscoring how hard it is for his system to settle.
By contrast, our other symptomatic patients (044 and 005) show LF dominating HF throughout, signalling a chronically tense autonomic state.
The healthy subject 115 starts with LF and HF almost equal; as effort mounts the gap widens in a smooth, orderly fashion.
Sonically, LF and HF make a natural complement to the VLF layer. We can map their absolute values to pitch in the second octave while using the LF/HF ratio to shape timbre—blending from a pure sine wave toward an edgier saw-like texture. When LF/HF is below 2, the sound stays near sine (calm, vagal tone); as the ratio exceeds 2, it becomes increasingly “saw-toothed,” evoking sympathetic arousal. Also, with this parameter, I would like to control the music scale from major to minor.
In practice, we see 115 and 091 resting in the neutral range and pushing upward only during exercise—the difference being that 115 ascends gradually, whereas 091 leaps. Both glide back to baseline once the task ends.
Patients 044 and 005, however, begin with ratios already high and jittering, telegraphing their persistent sympathetic load.
The next stage will be to develop an algorithm that converts these metrics into MIDI messages that can be mapped to parameters inside a DAW, or, alternatively, to build a SuperCollider or Pure Data patch implementing the same control scheme.
Before we can compare a “healthy” and a “clinical” heart, we first need a small tool-chain that does three things automatically:
detects each normal-to-normal (NN) beat in a raw ECG trace,
converts those beats into the core HRV metrics (HR, SDNN, RMSSD, VLF, LF, HF, LF/HF) and
plots every curve on an interactive dashboard so that trends can be inspected side-by-side.
Because the long-term goal is a live installation (eventually driving MIDI or other real-time mappings), the script is written from the start in a sliding-window style: at every step it re-computes each metric over a moving chunk of data. Fast-changing variables such as heart-rate itself can use short windows and small hops; spectral indices need at least a five-minute span to remain physiologically trustworthy. Shortening that span may make the curves look “lively,” but it also distorts the underlying autonomic picture and breaks any attempt to compare one participant with another. The code therefore lets the user set an independent window length and step size for the time-domain group and for the frequency-domain group. Let’s take a closer look at the code. If you want to see the full, visit: https://github.com/ninaeba/EmbodiedResonance
1. Imports and global parameters
import argparse
import sys
from pathlib import Path

import numpy as np
import pandas as pd
import plotly.graph_objs as go
import scipy.signal as sg
import neurokit2 as nk
argparse – give the script a tiny command-line interface so we can point it at any raw ECG CSV.
NumPy / pandas – basic numeric work and table handling.
Butterworth 0.5–40 Hz is a widely used cardiology band-pass that suppresses baseline wander and high-frequency EMG, yet leaves the QRS complex untouched.
60s time-domain window strikes a balance: long enough to tame noise, short enough for semi-real-time trend tracking.
300s spectral window is deliberately longer; the literature shows that the lower bands (especially VLF) are unreliable below ~5 min.
FGRID – dense frequency grid (1 mHz spacing) for a smoother Lomb curve.
3. ECG helper class – load, (optionally) filter, detect R-peaks
load – reads the CSV into a flat float vector and sanity-checks that we have >10 s of data.
filt – if the --nofilt flag is absent, applies a 4-th-order zero-phase Butterworth band-pass (via filtfilt) so that the baseline drift of slow breathing (or cable motion) does not trick the peak detector.
r_peaks – delegates the hard work to neurokit2.ecg_process, which combines Pan-Tompkins-style amplitude heuristics with adaptive thresholds; returns index positions and their timing in seconds.
time_metrics converts every RR sub-series into three classic metrics – HR (beats/min), SDNN (overall beat-to-beat spread, ms), RMSSD (short-term jitter, ms).
Why Lomb–Scargle instead of Welch? The RR intervals are unevenly spaced by definition.
Welch needs evenly sampled tachograms or heavy interpolation → can distort the spectrum.
Lomb operates directly on irregular timestamps, preserving low-frequency content even if breathing or motion momentarily speeds up/slows down the heart.
lomb_bandpowers:
Runs scipy.signal.lombscargle on de-trended RR values.
Integrates power inside canonical VLF / LF / HF bands.
Computes LF/HF ratio, but guards against division by tiny HF values.
time_series / freq_series slide a window (120 s or 300 s) across the experiment, jump every 30 s, calculate metrics, and store the mid-window timestamp for plotting.
compute finally stitches time-domain and frequency-domain rows onto a 1-second master grid so that all curves overlay cleanly.
Left y-axis = filtered ECG trace for QC (do peaks line up?).
Right y-axis = every HRV curve.
Built-in range-slider lets you scrub the 24-minute protocol quickly.
Hover shows exact numeric values (handy when you are screening anomalies).
different backgrounds for phases
7. CLI wrapper
if __name__ == '__main__':
    main()
Inside main() we parse the file name and the --nofilt flag, run the whole pipeline, save the HRV table as a CSV sibling (same stem, suffix .hrv_lomb.csv) and open the Plotly window.
The four summary plots included below are therefore not an end-point but a launch-pad: they give us a quick visual fingerprint of each participant’s autonomic response, and will serve as the reference material for deeper statistical comparison, pattern-searching, and—ultimately—the data-to-sound (or other real-time) mappings we plan to build next.
Heart-rate variability, or HRV, is the tiny, natural wobble in the time gap from one heartbeat to the next. It exists because two automatic “pedals” are always tugging at the heart. One pedal is the sympathetic system, the same chemistry that makes your pulse race when you are startled. The other pedal is the vagus-driven parasympathetic system, the brake that slows the heart each time you breathe out or settle into a chair. The more freely these pedals can trade places, the more variable those beat-to-beat spacings become. HRV is therefore a quick, non-invasive way to listen to how relaxed, alert, or exhausted the body is.
When we measure HRV we usually pull out a few headline numbers.
SDNN is the overall statistical spread of beat intervals during a slice of time, for example one minute. A wide spread means the heart is flexible and ready to react. A very narrow spread means the system is locked in one gear, as happens in chronic stress or heart failure.
RMSSD zooms in on the jump from one beat to the very next, averages those jumps, and reflects how strongly the vagus brake is speaking. During slow, deep breathing RMSSD grows larger; during mental tension or sleep deprivation it falls.
Frequency-domain measures treat the heartbeat trace like a piece of music and ask how loud each note is. Very-low-frequency power, or VLF, comes from extremely slow body rhythms such as hormone cycles and temperature regulation. Low-frequency power, or LF, sits in the middle and rises when the sympathetic pedal is pressed, for example in the first minute of exercise or during mental arithmetic. High-frequency power, or HF, sits exactly at breathing speed and is almost pure vagus activity: it swells during calm, diaphragmatic breathing and shrinks when breathing is shallow or hurried. A simple way to summarise the tug-of-war is the LF-to-HF ratio. When the sympathetic pedal dominates the ratio climbs; when the vagus brake dominates the ratio slides downward.
In a healthy, rested adult who is quietly seated the heart rate is steady but not rigid. SDNN and RMSSD show a modest but clear jitter, HF power pulses in step with the breath, LF is similar in size to HF, and the LF/HF ratio hovers around one or two. If the same person begins brisk walking heart rate rises, HF power fades, LF power grows, and the LF/HF ratio can shoot above five. During slow breathing meditation RMSSD and HF surge while LF/HF drops below one. In someone with chronic anxiety or PTSD the resting pattern is different: SDNN and RMSSD are low, HF is thin, LF/HF is already high before any task, and it climbs even higher during mild stress. The pattern can be even flatter in advanced heart disease, where both pedals are weak and total HRV is minimal.
Put simply, HRV lets us watch the nervous system’s soundtrack: fast notes reflect breathing and relaxation, mid-notes reflect alertness, and the overall volume tells us how much capacity the system still has in reserve.
The raw material for every HRV metric is the NN-interval sequence: NNi is the time in seconds between two consecutive normal (sinus) beats.
SDNN is the standard deviation of that sequence.
SDNN = √[ Σ (NNi – NN̄)² / (N – 1) ] Units are milliseconds because the intervals are expressed in ms. A resting, healthy adult who sits quietly will usually show an SDNN between roughly 30 ms and 50 ms. Endurance athletes can sit in the 60–90 ms range, while chronically stressed or cardiac patients may drift below 20 ms.
RMSSD focuses on the beat-to-beat jump and is dominated by parasympathetic (vagal) tone.
RMSSD = √[ Σ ( NNi – NNi-1 )² / (N – 1) ] Again the unit is milliseconds. Typical resting values in a calm, healthy adult are about 25–40 ms. Slow breathing, a nap, or meditation can push it up toward 60 ms, whereas sustained mental effort, anxiety, sleep deprivation, or PTSD often pull it down below 15 ms.
Frequency-domain indices start from the same NN series but first convert it into a power-spectrum, most accurately with a Lomb–Scargle periodogram when the points are unevenly spaced:
P(f) = (1/2σ²) { [ Σ NNi cos ωi ]² / Σ cos² ωi + [ Σ NNi sin ωi ]² / Σ sin² ωi } where ω = 2πf and f is scanned from 0.003 Hz upward.
Power is then integrated over preset bands and reported in ms² because it represents variance of the interval series per hertz.
Very-low-frequency power VLF integrates P(f) from 0.003 Hz to 0.04 Hz. In a healthy resting adult VLF is often 500–1500 ms². Because the mechanisms behind VLF (thermoregulation, hormones, renin-angiotensin cycle) change only slowly, values can drift greatly between individuals and between days.
Low-frequency power LF integrates P(f) from 0.04 Hz to 0.15 Hz. A quiet, healthy adult usually sits near 300–1200 ms². LF rises when the sympathetic accelerator is pressed, for example during the first few minutes of exercise or a stressful mental task.
High-frequency power HF integrates P(f) from 0.15 Hz to 0.40 Hz, exactly the normal breathing range. Calm diaphragmatic breathing drives HF toward 400–1200 ms², whereas rapid or shallow breathing in anxiety or hard exercise cuts HF sharply, sometimes below 100 ms².
LF/HF is the simple ratio LF ÷ HF. At rest a ratio near 1–2 suggests a balanced tug-of-war. If the ratio soars above 5 the sympathetic branch is clearly on top; if it falls below 0.5 the vagus brake is dominating (seen in deep meditation or in some fainting-prone individuals).
All of these numbers rise and fall in real time as the two branches of the autonomic nervous system jostle for control, so plotting them across the exercise-rest protocol lets us see how quickly and how strongly each person’s physiology reacts and recovers.
Metric
Units
What It Reflects (plain-language)
Typical Resting Range in Healthy Adults*
When It Runs High (what that often means)
When It Runs Low (what that can signal)
Mean Heart Rate (HR)
beats per minute (bpm)
How fast the heart is beating on average
50 – 80 bpm
Physical effort, fever, anxiety, dehydration
Excellent cardiovascular fitness, medications that slow the heart
SDNN
milliseconds (ms)
Overall “spread” of beat-to-beat intervals—long-term autonomic flexibility
40 – 60 ms
Good recovery, calm alertness, athletic conditioning
Chronic stress, heart disease, PTSD, over-fatigue
RMSSD
ms
Very short-term vagal (rest-and-digest) shifts from one beat to the next
25 – 45 ms
Deep relaxed breathing, meditation, lying down
Sympathetic overdrive, poor sleep, depression
VLF Power
ms²
Very-slow oscillations (< 0.04 Hz) tied to long hormonal / thermoregulatory rhythms
600 – 2000 ms²
Possible inflammation, overtraining, sustained stress load
Heart rate is a fundamental indicator of mental health, with heart rate variability (HRV) playing a particularly significant role. HRV refers to the variation in time intervals between heartbeats, reflecting autonomic nervous system function and overall physiological resilience. It is measured using time-domain, frequency-domain, or non-linear methods. Higher HRV is associated with greater adaptability and lower stress levels, while lower HRV is linked to conditions such as PTSD, depression, and anxiety disorders.
Studies have shown that HRV differs between healthy individuals and those with PTSD. In a resting state, people with PTSD typically exhibit lower HRV compared to healthy controls. When exposed to emotional triggers, their HRV may decrease even further, indicating heightened sympathetic nervous system activation and reduced parasympathetic regulation. Bessel van der Kolk’s work in “The Body Keeps the Score” highlights how trauma affects autonomic regulation, leading to dysregulated physiological responses under stress.
There are two primary methods for measuring heart rate: electrocardiography (ECG) and photoplethysmography (PPG).
Feature
ECG
PPG
Measurement Principle
Uses electrical signals produced by heart activity
Uses light reflection to detect blood flow changes
Accuracy
Gold standard for medical HR monitoring
Uses ECG as reference for HR comparison
Heart Rate (HR) Measurement
Highly accurate
Suitable for average or moving average HR
Heart Rate Variability (HRV)
Can extract R-peak intervals with millisecond accuracy
Limited by sampling rate, better for long-duration measurements (>5 min)
Time to Obtain Reading
Quick, no long settling time required
Requires settling time for ambient light compensation, motion artifact correction
pic
sensor name
link
price
what it measures
specification
features
usage case
Gravity: Analog Heart Rate Monitor Sensor (ECG) for Arduino
ECG records the electrical activity of the heart using electrodes placed on the skin, providing high accuracy in detecting R-R intervals, which are critical for HRV analysis. PPG, in contrast, uses optical sensors to detect blood volume changes in peripheral tissues, such as fingertips or earlobes. While PPG is convenient and widely used in consumer devices, it is more susceptible to motion artifacts and may not provide the same precision in HRV measurement as ECG.
Additionally, some PPG sensors include pulse oximetry functionality, measuring both heart rate and blood oxygen saturation (SpO2). One such sensor is the MAX30102, which uses red and infrared LEDs to measure oxygen levels in the blood. The sensor determines SpO2 by comparing light absorption in oxygenated and deoxygenated blood. Since oxygen levels can influence cognitive function and stress responses, these sensors have potential applications in mental health monitoring. However, SpO2 does not provide direct information about autonomic nervous system function or HRV, making ECG a more suitable method for this project.
For this project, ECG is the preferred method due to its superior accuracy in HRV analysis. Among available ECG sensors, the AD8232 module is a suitable choice for integration with microcontrollers such as Arduino. The AD8232 is a single-lead ECG sensor designed for portable applications. It amplifies and filters ECG signals, making it easier to process the data with minimal noise interference. The module includes an output that can be directly read by an analog input pin on an Arduino, allowing real-time heart rate and HRV analysis.
HRV is calculated based on the time intervals between successive R-peaks in the ECG signal. One of the most commonly used HRV metrics is the root mean square of successive differences (RMSSD), which is computed using the formula:
where RRi represents the ith R-R interval, and N is the total number of intervals. Higher RMSSD values indicate greater parasympathetic activity and better autonomic balance. Among ECG sensors available on the market, the Gravity: Analog Heart Rate Monitor Sensor (ECG) is the most suitable for this project. It is relatively inexpensive, includes electrode patches in the package, and has well-documented Arduino integration, making it an optimal choice for HRV measurement in experimental and practical applications.
Having already defined and analyzed loneliness I will now take a phenomenological approach in order to gain a more rounded and holistic understanding of the concept. This means looking at the actual experience of what it means, feels and looks like for individuals to be lonely. This can mean asking how loneliness is experienced physically, how it shapes our experience of time and sense of space, how it affects our relationships with others, our attitude towards other experiences or how loneliness is approached in general (negatively or positively).
Barbara Schellhammer initially sees loneliness as a structural problem and criticizes measures such as the ministry of loneliness as an approach against the loneliness epidemic. They simply treat a symptom, however the fundamental problem and one of the the origins of society’s increasing loneliness lies primarily in the fact that in recent years politicians have cut back on the funding of communal spaces that are essential for community and connection (more on this in Post 5 on Third Places). It raises the question of which loneliness should be addressed at all and clearly shows how loneliness can be a completely different experience for different people in different scenarios: From the lonely senior citizen who is only cared for by robots, to single households who almost exclusively virtually search the internet for a partner or the homeless, uprooted refugee separated from their family [1].
Nicht-Orte (Non-Places) “Loneliness never exists in itself, but only for someone who experiences it in a very unique way. It results from a history that extends far beyond one’s own, it is rooted in lived time, in specific cultural structures and nests itself stubbornly in certain places” [1]
„[The] weakening of the identity of places to the point where they not only look alike but feel alike and offer the same bland possibilities for experience“ – Edward Relph
The phenomenon of non-places was first described by Marc Augé and describes places, especially in urban areas, that are used monofunctionally (train stations, airports, shopping centers), which is in stark contrast to traditional anthropological places that are full of culture, history, identity, communication and relation [see also: Heterotopia – places with predetermined experience that are restrictive in experience and access, such as retirement homes or hospitals]. These places are often characterized by a functionality that does not promote social contact or interpersonal interaction. They offer little space for the development of individual identity or for genuine connections between people. One reason why non-places are associated with loneliness lies in their temporary and functional nature. They are designed to be transit places where people generally only stay for a short time. This fast-paced, anonymous atmosphere can reinforce feelings of isolation [2]. As a counterpart to this, there is the idea of „in-between places“ (Zwischenorte) that promote community and open up spaces for encounters. The aim is to create spaces that promote openness, dialog and emotional contact, something that is often lost in everyday life [1,4].
Loneliness as a negative experience Loneliness is often perceived as strange, wrong, shameful, or even taboo. Society frequently associates it with lower status or a personal deficit, creating pressure to avoid being alone. Many feel the need to justify their solitude with excuses like being unwell or having work, as if simply choosing to be alone is unacceptable. This societal stigma stems from deeply ingrained childhood experiences and cultural norms, making it difficult for some to embrace solitude. It’s not just being alone but feeling unwanted, forgotten, or unnecessary, especially by those you value most and often rooted in rejection, exclusion, or abandonment. This form of loneliness is defined by the loss of connections, a longing for companionship, and a sense of invisibility or lack of place. It can have an affect on both mind and body, leading to stress, discomfort, or unhealthy coping mechanisms. When feeling unseen or misunderstood, loneliness can even occur when surrounded by other people.This can mean feeling isolated in social settings like parties due to superficial interactions or feeling lonely in a close relationship when feeling overlooked or unappreciated, leading to emotional invisibility. Also feeling isolated due to differences like disability, lifestyle, or personal choices can make a person feel lonely. In all cases, loneliness arises from a lack of emotional connection and the pain of feeling unseen or misunderstood, emphasizing the importance of being acknowledged and valued by others. [3]
However, loneliness does not have to be negative – it can even be appreciated or seen as positive when separated from these harmful views.
Loneliness as a positive experience Loneliness, when chosen or voluntary, can be a source of rest, creativity, and serenity. Unlike painful loneliness, this form is experienced as harmonious, calming, and even empowering. It allows one to connect with oneself, recharge, and reflect. While virtual interactions can reduce feelings of isolation, they lack the embodied richness of real-life interactions. Occupations like reading, crafting, or listening to music can also transform loneliness into a meaningful experience. This positive form of loneliness requires personal strength and the ability to face oneself. Over time, one can develop an appreciation for solitude, realizing it is not a sign of inadequacy but a way to connect more deeply with oneself and even enhance future social interactions, as long as you connect with something in some way. [3] The contrast and balance between solitude and connection enhance both: those who embrace solitude can connect openly with others, and healthy relationships enable solitude to become a source of strength and inspiration [1].
Sources
B. Schnellhammer, “Eine phänomenologische Annäherung an die Erfahrung der Einsamkeit”, April 2020, https://www.researchgate.net/publication/340502352_Eine_phanomenologische_Annaherung_an_die_Erfahrung_der_Einsamkeit
M. Augé “Orte und Nicht-Orte”, https://swiki.hfbk-hamburg.de/Medienoekologie/uploads/auge-ortenichtorte.pdf
K. Dahlberg, “The enigmatic phenomenon of loneliness”, July 2009, https://www.researchgate.net/publication/232058607_The_enigmatic_phenomenon_of_loneliness
H. Rosa, “Resonanz”, https://books.google.at/books?hl=en&lr=&id=MUeWCwAAQBAJ&oi=fnd&pg=PT3&dq=soziologie+der+weltbeziehung&ots=zNQRoPz929&sig=mbBXxjo9zRRTtzeJy4XLK5h8Ho0&redir_esc=y#v=onepage&q=soziologie%20der%20weltbeziehung&f=false
Social connection and satisfying relationships are fundamental for development, reproduction and survival. The impact of social influences on health and well-being has been extensively investigated through diverse scientific methodologies like epidemiological studies, network analyses, clinical trials and controlled experiments. Consistent evidence indicates that loneliness and social isolation negatively affect mental, physical, and cognitive health, with the most compelling findings linking these factors to an increased risk of premature mortality. 1 Several meta-analyses find that the risk of all-cause mortality is increased by 26 %. Moreover, these findings were consistent across various factors, including age, gender, cause of death, country of origin, and baseline health status 2
Existing research makes a difference in all-cause mortality and cause-specific mortality, particularly when talking about cardiovascular diseases or strokes. All-cause mortality refers to the collective risk of death from all conditions associated with loneliness, while cause-specific mortality focuses on the risk of dying from a specific condition closely linked to loneliness or social isolation.
Research has explored the individual and combined effects of loneliness and social isolation on mortality risk. While both factors independently correlate with higher mortality, studies suggest that social isolation is the stronger predictor when both are analyzed together. For example, some studies show that only social isolation remained significant after controlling for demographic, socio-economic, and health factors. 3 Beller and Wagner observed that loneliness and social isolation interact synergistically: greater social isolation amplifies the impact of loneliness on mortality, while higher loneliness intensifies the effect of social isolation. 4
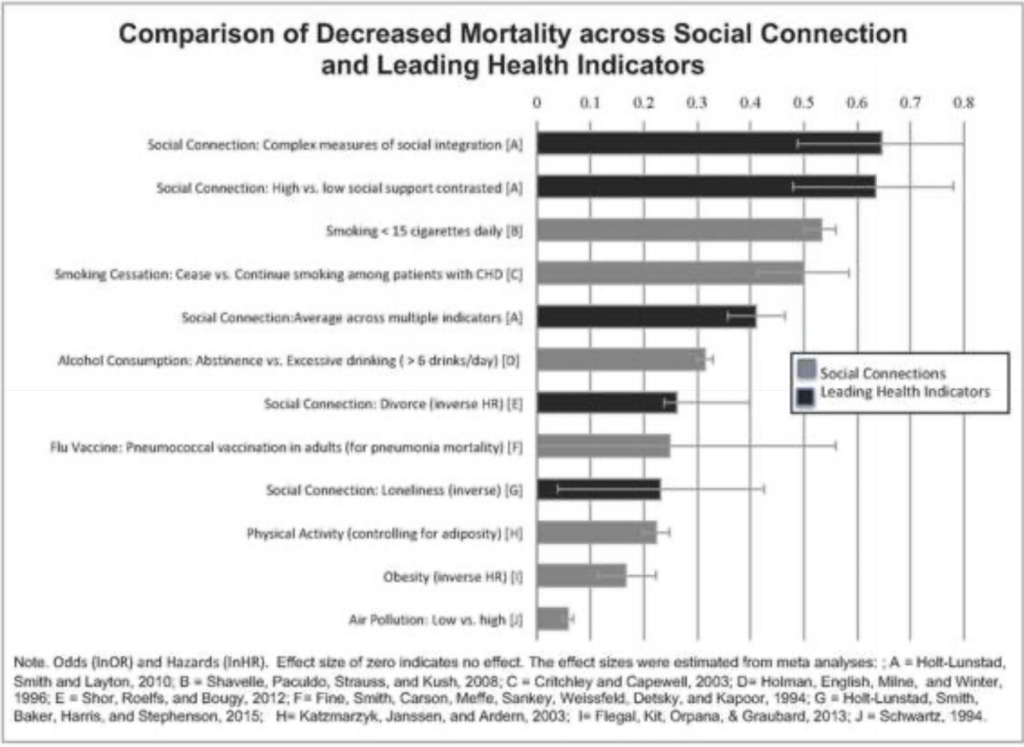
The impact of social relationships on mortality risk can be compared to other well-established lifestyle risk factors like physical activity, alcohol consumption, smoking cigarettes, air pollution or obesity. 5
Comparison of Decreased Mortality across social connection and leading health indicators 3
Physical health
In addition to their association with increased mortality risk, social isolation and loneliness are linked to various health issues, including cardiovascular diseases, stroke, functional decline, and, to some extent, reduced immune function and diabetes. 3
Cardiovascular diseases Cardiovascular diseases include diseases affecting the heart or blood vessels like heart attacks or strokes. A meta-analysis which is based on 23 different studies shows that loneliness and social isolation are linked to a 29 % higher risk of coronary heart disease and a 32 % higher risk of stroke. These associations were observed in both genders and remained significant regardless of traditional heart disease risk factors. Studies show that loneliness is linked to an increased risk of high blood pressure, particularly among middle-aged and older adults, and inflammatory reactivity. 3
Functional and motor decline Loneliness is linked to increased functional and motor decline, including greater difficulty with activities of daily living and reduced muscle strength, mobility, and motor performance. 6 It remains unclear whether loneliness contributes to functional decline directly or indirectly through processes like cardiovascular diseases or inflammation. 7
Diabetes and cholesterol Few studies have linked loneliness to developing diabetes for men. A cross-sectional study in Switzerland shows that lonely people have a 40 % higher chance of developing diabetes and 31 % higher chance to have higher cholesterol levels. 8
Cognitive Health
Cognitive function encompasses a range of mental processes that enable an individual to acquire knowledge, reason, and carry out plans. These processes include perception, memory, learning, attention, decision-making, and language skills. 9
Cognitive decline Several studies have explored the relationship between loneliness and/or social isolation, and cognitive decline, especially in older adults. Even though some studies show a link between loneliness and cognitive decline, they cannot agree on what part of the cognitive function is affected. 3
Alzheimer’s and Dementia Most evidence suggests a correlation between loneliness and dementia, comparable to the other dementia risk factors like physical activity, low education and late-life-depression. 10 While a study from 2018 found no association between loneliness and dementia, there are other studies showing that there is a link between loneliness and developing dementia. To address the potential problem of reversed causality – where early-stage dementia leads to difficulties engaging in social interactions and therefore people feeling lonely – the study doesn’t include people in those early stages. 3
Mental health
A wide range of literature shows a significant relationship between loneliness and mental health issues like depression and anxiety as well as suicide and suicidal ideations. 3
Depression and Anxiety Lonely individuals tend to experience more depressive symptoms and report being less happy, less satisfied, and more pessimistic. Additionally, loneliness and depression share common features, such as feelings of helplessness and emotional pain. 11 Another study also shows an association between poor social connection and social anxiety in both adolescents and adults. 1
Suicide and Suicidal Ideation Studies indicate a connection between loneliness and suicide. A study of individuals who have attempted suicide found that loneliness is frequently cited as a contributing factor. 12
Taking loneliness seriously
Research shows that loneliness affects health, but the relationship is also bidirectional – some health conditions such as poor physical health, disabilities, or hearing loss, can also increase the likelihood of loneliness. The reported evidence highlights that loneliness should be taken more seriously as a risk factor for various health problems. 3
Sources
[1] J. Holt-Lunstad und Department of Psychology, Brigham Young University, Provo, Utah, USA, „Social Connection as a Public Health Issue: The Evidence and a Systemic Framework for Prioritizing the “Social” in Social Determinants of Health“, 2022. [Online]. Verfügbar unter: https://doi.org/10.1146/annurev-publhealth-052020-110732
[2] J. Holt-Lunstad, T. B. Smith, M. Baker, T. Harris, and D. Stephenson, “Loneliness and social isolation as risk factors for mortality: A meta-analytic review,” *Perspect. Psychol. Sci.*, vol. 10, no. 2, pp. 227–237, Mar. 2015, doi: 10.1177/1745691614568352. PMID: 25910392.
[3] J. Baarck, M. Kovacic und Joint Research Centre (JRC), „The Relationship between Loneliness and Health“, Publications Office of the European Union, literature review, 2022. doi: 10.2760/90915.
[4] J. Beller and A. Wagner, “Loneliness, social isolation, their synergistic interaction, and mortality,” Health Psychol., vol. 37, no. 9, pp. 808–813, Sep. 2018, doi: 10.1037/hea0000605. PMID: 30138019.
[5] J. Holt-Lunstad, T. F. Robles und D. A. Sbarra, „Advancing social connection as a public health priority in the United States.“, American Psychologist, Bd. 72, Nr. 6, S. 517–530, Sep. 2017, doi: 10.1037/amp0000103.
[6] K. Beaton and K. Grimmer, “Tools that assess functional decline: systematic literature review update,” Clin. Interv. Aging, vol. 8, pp. 485–494, 2013. Available at: https://doi.org/10.2147/CIA.S42528.
[7] A. S. Buchman et al., “Loneliness and the rate of motor decline in old age: the Rush Memory and Aging Project, a community-based cohort study,” BMC Geriatr., vol. 10, no. 1, p. 77, 2010. Available at: https://doi.org/10.1186/1471-2318-10-77.
[8] R. A. Richard, S. Rohrmann, C. L. Vandeleur, M. Schmid, J. Barth, and M. Eichholzer, “Loneliness is adversely associated with physical and mental health and lifestyle factors: Results from a Swiss national survey,” PLoS One, vol. 12, no. 7, p. e0181442, Jul. 2017, doi: 10.1371/journal.pone.0181442. PMID: 28715478; PMCID: PMC5513556.
[9] K. Kiely, “Cognitive function,” in Encyclopedia of Quality of Life and Well-Being Research, A. C. Michalos, Ed., Dordrecht: Springer Netherlands, 2014, pp. 483–484. Available at: https://doi.org/10.1007/978-94-007-0753-5_2939.
[10] J. S. Kuiper, M. Zuidersma, R. C. Oude Voshaar, S. U. Zuidema, E. R. van den Heuvel, R. P. Stolk, and N. Smidt, “Social relationships and risk of dementia: A systematic review and meta-analysis of longitudinal cohort studies,” Ageing Res. Rev., vol. 22, pp. 39–57, Jul. 2015, doi: 10.1016/j.arr.2015.04.006. PMID: 25956016.
[11] R. Mushtaq, S. Shoib, T. Shah und S. Mushtaq, „Relationship Between Loneliness, Psychiatric Disorders and Physical Health ? A Review on the Psychological Aspects of Loneliness“, JOURNAL OF CLINICAL AND DIAGNOSTIC RESEARCH, Jan. 2014, doi: 10.7860/jcdr/2014/10077.4828.
[12] L. M. Heinrich, E. Gullone und School of Psychology, Psychiatry, and Psychological Medicine, Faculty of Medicine, Nursing, and Health Sciences, Monash University, VIC 3800, Australia, „The clinical significance of loneliness: A literature review“, 2006. [Online]. Verfügbar unter: https://doi.org/10.1016/j.cpr.2006.04.002
„The loneliness epidemic“ – a buzzword that has been coming up more and more in recent years. It seems to be an increasingly relevant topic, which is quite interesting and somewhat paradox, considering the parallel increase of innovative technology for creating connections between millions of people, no matter the time of day or location on the planet. However, something seems to be wrong. Reports show that around a third of the population of industrialized countries are affected by loneliness [1]. The group most affected by loneliness are young adults between 16 and 24 [5] and what is even more concerning – this number has been rising over the past few years [6]. The WHO has even declared loneliness a global public health concern in 2023 and launched and international commission to study the problem [2]. How can loneliness be such a prominent topic and increasing issue, when we are more connected than ever? This makes for an interesting research topic in which I will be asking the question of how interaction design can combat loneliness.
First of all, to better understand the topic of loneliness, the term has to be defined and differentiated from similar ones such as aloneness, solitude and social isolation, as these mean slightly different things. Aloneness and social isolation describe qualitative, objective measures in which an individual has no one around them. More subjective measures include solitude and loneliness. While solitude describes a feeling of voluntary aloneness, which is mostly a positive experience, loneliness is the opposite and describes a negative experience of the state of being alone [3]. There is no one definition of what loneliness is exactly, generally it is agreed that it can be described as the subjective discrepancy between an individual’s existing versus desired social relationships [1]. When looked at more closely, loneliness can be further categorized into three types. Social loneliness means the feeling of isolation from a social network or community. Simply put: the missing sense of belonging. Emotional loneliness describes the sense of lacking close, intimate, emotional connections. Finally, existential loneliness refers to a deeper inner feeling of being fundamentally alone in life. Further categorizations include transient, situational and chronic loneliness [3].
Since loneliness is for the most part a subjective feeling, it can be quite tricky to measure it for studies and observation. One of the most prominent attempts to measure loneliness is the UCLA loneliness scale which has bee revised several times and works like a relatively simple questionnaire [4].
Loneliness has a significant impact on mental and physical health. It can contribute, as well as cause depression. This vicious cycle has a high risk of increasing early mortality. With depression being the most common mental health issue, loneliness is a topic that should not be overlooked, since they are often intertwined [7]. Loneliness can also harm the body physically. Diabetes, autoimmune disorders, cardiovascular diseases, obesity, physiological aging, cancer, poor hearing and overall poor health have been found to be caused by loneliness [1,7]. Addressing loneliness could be an important step in the battle against the mental health crisis and improvement of physical wellbeing. Besides mental and physical health loneliness can even impact the economy. Poorer work performance and lower educational attainment have been associated with loneliness and its accompanying symptoms. This is estimated to cost employers millions per year due to employee sickness, caring activity, productivity, and voluntary staff turnover [8].
It is clear that we need to better understand the loneliness epidemic in order to work on solutions that bring us together.
Sources
C. Park et al., „The Effect of Loneliness on Distinct Health Outcomes: A Comprehensive Review and Meta-Analysis“, December 2020, doi: https://doi.org/10.1016/j.psychres.2020.113514
„WHO Commission on Social Connection“, World Health Organization [Online], Available: https://www.who.int/groups/commission-on-social-connection, Accessed: December 2024
„Definitions of lonely, isolated, alone, and solitude“, what works wellbeing, [Online], Available: https://whatworkswellbeing.org/resources/definitions-of-lonely-isolated-alone-and-solitude/, Accessed: December 2024
D. Russell, UCL Loneliness Scale, Fetzer Institute, Available: https://fetzer.org/sites/default/files/images/stories/pdf/selfmeasures/Self_Measures_for_Loneliness_and_Interpersonal_Problems_UCLA_LONELINESS.pdf
„16 to 24 year olds are the loneliest generation“, UKOnward, Available: https://www.ukonward.com/data/how-often-do-you-feel-lonely/, Accessed: January 2025
„Community Life Survey 2023/24: Loneliness and support networks“, gov.uk, Available: https://www.gov.uk/government/statistics/community-life-survey-202324-annual-publication/community-life-survey-202324-loneliness-and-support-networks–2, December 2024
R. Mushtaq, „Relationship Between Loneliness, Psychiatric Disorders and Physical Health ? A Review on the Psychological Aspects of Loneliness“, September 2014, doi: 10.7860/JCDR/2014/10077.4828
Campaign to End Loneliness, “Facts and Statistics – Campaign to end loneliness,” Campaign to End Loneliness, May 10, 2024. https://www.campaigntoendloneliness.org/facts-and-statistics/
In an increasingly urbanized and digital world, public spaces are no longer the main place for community and interaction they once were. However, while global connectedness has rapidly increased thanks to modern technology, smartphones and social media many people, despite being surrounded by others, feel disconnected, isolated and lonely. Public spaces, like parks, libraries, and cafés, have always served as places where people come together. But as our lives become more fast-paced and technology-driven, these spaces are not the first choice for seeking connection, with most digital online solutions being more convenient and accessible.
I find the paradox of a rapidly evolving world, where global connectedness and interaction are increasing, yet loneliness is at an all-time high, to be a fascinating premise. It is a topic that – at least to a certain degree – almost everyone is affected by, and understanding what differentiates different kinds of interaction and connection (e.g. online and face to face) will only become more important in the future, especially for interaction designers. I see designing connection and interaction as an important starting point to tackling many different societal issues, loneliness being only one of them.
Interaction design is the practice of designing the way people interact with technology, environments, and most importantly: each other. It therefore offers the potential to rethink how public spaces function. By creating interactive experiences, design can invite people to slow down, engage with their surroundings, and connect with others in creative and meaningful ways. With the increasing issue of loneliness, the principles of interaction design and the potential of public spaces I want to ask and aim to answer the question how design can combat loneliness by reshaping the way we interact in public spaces.
When diving deeper into the topic of loneliness, several sub-questions arise for further exploration and understanding. To tackle loneliness at its core, it is important to understand what loneliness is exactly and what the root causes are. These foundational questions help define the phenomenon and uncover why it emerges in various contexts. The effects should also be looked at more closely, posing questions such as: What does loneliness do to us? – physically, emotionally, and socially. Especially when it comes to exploring and developing possible solutions exploring the flip side, will be important. Questions like What is connection? How do we connect? and examining the mechanisms of building (meaningful) bonds are important. Researching on a broader scale, learning about basic human needs and how communities are built is another important aspect that should be considered.
More specific topics for interaction design could include reimagining third spaces like parks or cafes to encourage interactions, designing interactive and participatory experiences, or developing digital platforms that prioritize meaningful engagement over superficial connections. Additionally, incorporating haptic and sensory elements, such as touch-based installations or shared experiences, can evoke a stronger feeling of presence and connection. It’s essential to ask whether the spaces we design truly foster connection, and whether technological connectedness actually equals connection – fulfilling our need to be understood and supported. Some interesting ideas for design spaces with connection and community in mind have already been implemented. In many cities, including Graz, places like „Repair Cafés“ [1] can be found. These are spaces where people can not only fix their broken items, but also socialize, connect and learn from each other. “Maggie Centers” [2] provide a place for people affected by cancer in which they can come together, talk, connect and bond over workshops and activities.
It is important to keep in mind that loneliness is a very large and hard to grasp topic. There is existing research, however the approaches and understanding of the topic still vary. Even a general consensus on how to define the term itself hasn’t been found. It can mean different things to different people and it can have various root causes, which means a solution could look very different for many people. An interesting approach could therefore be focusing on human needs in terms of social connection, belonging and purpose, which are things that directly contrast loneliness. When working on possible solutions it is important to keep in mind that there is no one cure, since loneliness as well as connection are complex and deeply personal.
In the upcoming blogposts, I will explore the broader topic of loneliness, connection, and community to gain a solid understanding and foundation of the topic. From there, I will investigate more specific elements of the research question by taking a look at spaces and environments that foster social interaction, such as third and fourth spaces, as well as principles of designing for connection and belonging. I will also look at case studies and examples of successful design interventions to draw inspiration. This journey will ideally give valuable insights and opportunities for addressing loneliness through thoughtful and intentional interaction design.
Repair Café: https://www.repaircafe-graz.at/ Maggie Centers: https://www.maggies.org/our-centres/ The UK has recently launched a campaign to end loneliness:https://www.campaigntoendloneliness.org/ The loneliness lab is a global collective of people and organizations on a mission to design connection:https://www.lonelinesslab.org/
The mental health app market has witnessed significant growth, driven by technological advancements and a global focus on mental well-being. Valued at $6.12 billion in 2023, it is projected to expand further in the coming years. Here’s a snapshot of the current trends, market segmentation and future possibilities.
Depression and Anxiety Management: apps designed to help users cope with depression and anxiety through tools like CBT, mood tracking and guided exercises.
Meditation Management: apps like Calm and Headspace offering guided meditations, breathing exercises, and sleep aids.
Stress Management: platforms focused on stress-relief strategies, such as Happify, incorporating gamified exercises to engage users.
Wellness Management: apps aimed at holistic well-being, integrating fitness, nutrition, and mental health support.
Others: includes niche apps addressing specific challenges like postpartum depression, grief or addiction recovery.
By Target Audience:
Individuals Seeking Self-Help: students, working professionals and retirees seeking accessible, affordable mental health tools.
Healthcare Providers: clinicians using apps to complement traditional treatment plans.
Corporates: employers implementing wellness apps like Spring Health to enhance workplace well-being and productivity.
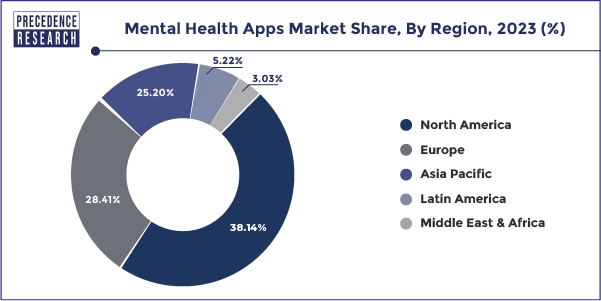
By Region:
North America leads the market with robust app adoption and mental health awareness, Asia-Pacific is growing rapidly, driven by increasing smartphone use and stress-related health concerns.
AI-Driven Personalization: apps are using AI to provide tailored mental health experiences. For example, Wysa and Woebot offer conversational AI support, while Kintsugi employs vocal biomarker analysis to detect emotional states.
Gamification for Engagement: apps like Happify use gamification to make mental health practices more engaging, particularly for younger audiences.
Integration with Wearables: real-time tracking of mental health indicators, like stress and emotional states, through wearable devices is becoming increasingly common.
Opportunities
Expanding Accessibility: affordable or free mental health apps can address gaps in underserved regions.
Corporate Wellness: more employers are expected to incorporate mental health apps into their benefits packages.
Enhanced Privacy and Trust: apps prioritizing user data security and ethical practices will gain consumer confidence.
What’s Next?
Niche Specialization: apps targeting specific demographics or conditions, such as adolescent mental health or postpartum support.
Integrated Care Models: enhanced collaboration between apps and healthcare providers for comprehensive mental health solutions.
Ethical AI Development: transparent and inclusive AI tools designed to meet high clinical standards.
As the market evolves, innovation and user-centric approaches will be crucial in addressing the diverse needs of a global audience.