The master thesis “Sound Response to Physicality: Artistic Expressions of Movement Sonification” was written by Aleksandra Joanna Słyż in 2022 at the Royal College of Music in Stockholm (Kungliga Musikhögskolan; Stockholm, Sweden).
Introduction
I chose Aleksandra Słyż’s master thesis because her topic immediately resonated with my own research interests. In my master project I am working with the x-IMU3 motion sensor to track surf movements and transform them into sound for a surf documentary. During my research process, the question of how to sonify movement data became central, and Słyż’s work gave me valuable insights into which parameters can be used and how the translation from sensor to sound can be conceptually designed.
Her thesis, Sound response to physicality, focuses on the artistic and perceptual dimensions of movement sonification. Through her work Hypercycle, she explores how body motion can control and generate sound in real time, using IMU sensors and multichannel sound design. I found many of her references—such as John McCarthy and Peter Wright’s Technology as Experience—highly relevant for my own thesis.
Gestaltungshöhe – Artistic Quality and Level of Presentation
Słyż’s thesis presents a high level of artistic and conceptual quality. The final piece, Hypercycle, is a technically complex and interdisciplinary installation that connects sound, body, and space. The artistic idea of turning the body into a musical instrument is powerful, and she reflects deeply on the relation between motion, perception, and emotion.
Visually, the documentation of her work is clear and professional, though I personally wished for a more detailed sonic description. The sound material she used is mainly synthesized tones—technically functional, but artistically minimal. As a sound designer, I would have enjoyed a stronger exploration of timbre and spatial movement as expressive parameters.
Innovationsgrad – Innovation and Contribution to the Field
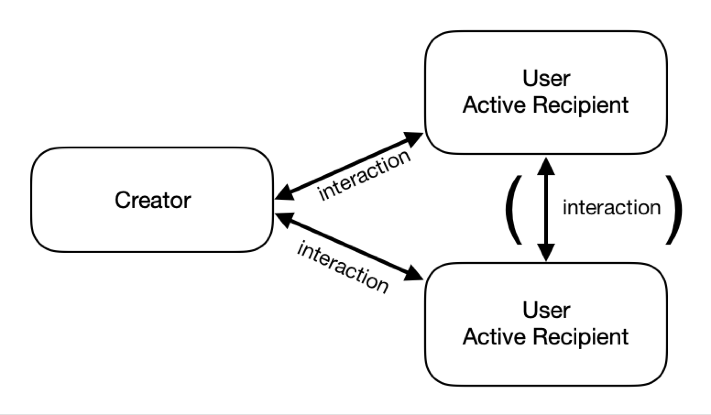
Using motion sensors for artistic sonification is not entirely new, yet her combination of IMU data, embodied interaction, and multichannel audio gives the project a strong contemporary relevance. What I found innovative was how she conceptualized direct and indirect interaction—how spectators experience interactivity even when they don’t control the sound themselves.
However, from a technical point of view, the work could have been more transparent. I was missing a detailed explanation of how exactly she mapped sensor data to sound parameters. This part felt underdeveloped, and I see potential for future work to document such artistic systems more precisely.
Selbstständigkeit – Independence and Original Contribution
Her thesis clearly shows independence and artistic maturity. She worked across disciplines—combining psychology, music technology, and perception studies—and reflected on her process critically. I especially appreciated that she didn’t limit herself to the technical side but also integrated a psychological and experiential perspective.
As someone also working with sensor-based sound, I can see how much self-direction and experimentation this project required. The depth of reflection makes the work feel authentic and personal.
Gliederung und Struktur – Structure and Coherence
The structure of the thesis is logical and easy to follow. Each chapter begins with a quote that opens the topic in a poetic way, which I found very effective. She starts by explaining the theoretical background, then moves toward the technical discussion of IMU sensors, and finally connects everything to her artistic practice.
Her explanations are written in clear English, and she carefully defines all important terms such as sonification, proprioception, and biofeedback. Even readers with only basic sound design knowledge can follow her reasoning.
Kommunikationsgrad – Communication and Expression
The communication of her ideas is well-balanced between academic precision and personal reflection. I like that she uses a human-centered language, often describing how the performer or spectator might feel within the interactive system.
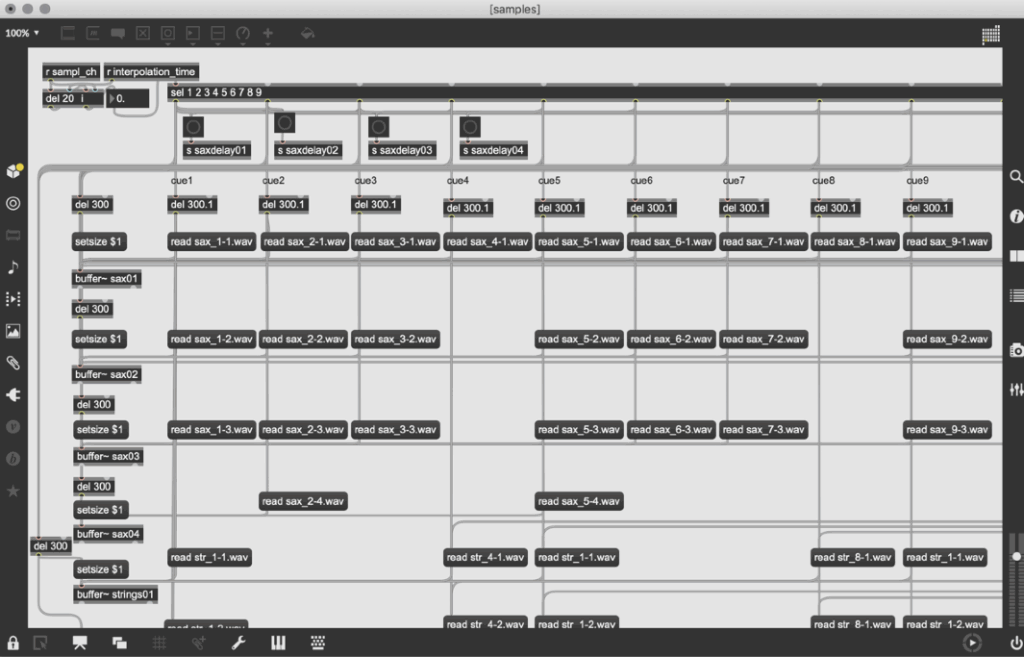
Still, the technical documentation of the sonification process could be more concrete. She briefly shows a Max/MSP patch, but I would have loved to understand more precisely how the data flow—from IMU to sound—was built. For future readers and practitioners, such details would be extremely valuable.
Umfang – Scope and Depth
The length of the thesis (around 50 pages) feels appropriate for the topic. She covers a wide range of areas: from sensor technology and perception theory to exhibition practice and performance philosophy. At the same time, I had the impression that she decided to keep the technical parts lighter, focusing more on conceptual reflection. For me, this makes the thesis stronger as an artistic reflection, but weaker as a sound design manual.
Orthography, Accuracy, and Formal Care
The thesis is very carefully written and proofread. References are consistent, and the terminology is accurate. She integrates both scientific and artistic citations, which gives the text a professional academic tone. The layout is clear, and the visual elements (diagrams, performance photos) are well placed.
Literature – Quality and Relevance
The literature selection is one of the strongest aspects of this work. She cites both technical and philosophical sources—from G. Kramer’s Sonification Report to McCarthy & Wright’s Technology as Experience and Tanaka & Donnarumma’s The Body as Musical Instrument. For me personally, her bibliography became a guide for my own research. I found new readings that I will also include in my master thesis.
Final Assessment – Strengths, Weaknesses, and Personal Reflection
Overall, Sound response to physicality is a well-balanced, thoughtful, and inspiring thesis that connects technology, perception, and art. Her biggest strength lies in how she translates complex sensor-based interactions into human experience and emotional resonance. The way she conceptualizes embodied interaction and indirect interactivity is meaningful and poetic.
The main weakness, in my opinion, is the lack of detailed technical documentation—especially regarding how the IMU data was mapped to sound and multichannel output. As someone building my own sonification system with the x-IMU3 and contact microphones, I would have loved to see the exact data chain from sensor to audio.
Despite that, her work inspired me profoundly. It reminded me that the psychological and experiential dimensions of sound are just as important as the data itself. In my own project, where I sonify the movement of a surfboard and the feeling of the ocean, I will carry this understanding forward: that sonification is not only about data translation but about shaping human experience through sound.
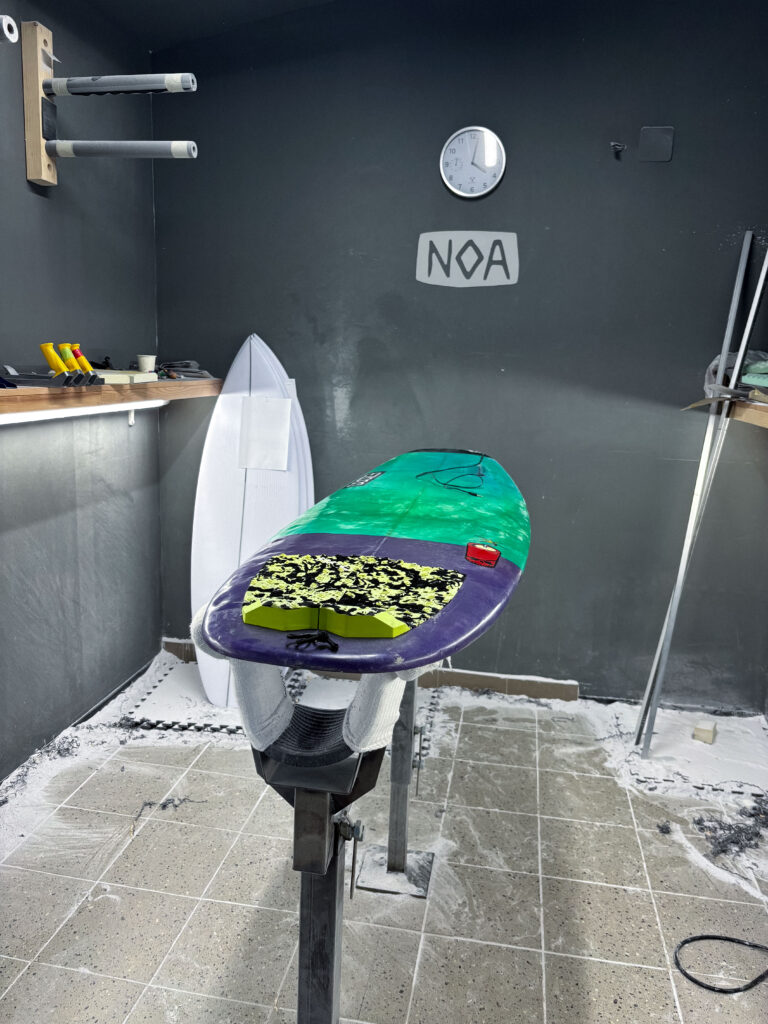
The base model and final prototype selected for this project is built on top of my own personal shortboard. It is measuring 5 feet 9 inches in length and is made for faster maneuvers like the cutback because of its short length and small volume. Considering these factors the board was selected due to its size and shape, which offer a wider range of motion and faster changes of speed and rotation in comparison to a longboard. Also, the dynamical movement and the internal board vibrations will be different than the one of a longboard or a board with a higher volume. Before the construction, a planning session was conducted with the Noa team to identify the ideal locations for sensor placement, cable routing, mounting of the housing, and material usage considering the exposure to saltwater.
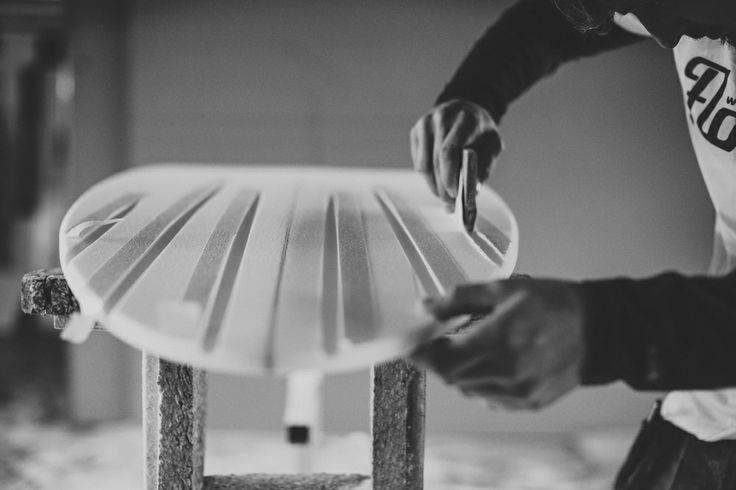
Noa surfboards is a small factory for shaping mostly shortboards and riverboards. With their own shaping studio, they represent one of the few professional shapers in the region of Austria and Germany. This studio was chosen for the professional knowledge and experience of shaping to develop a well-functioning and safe protype.
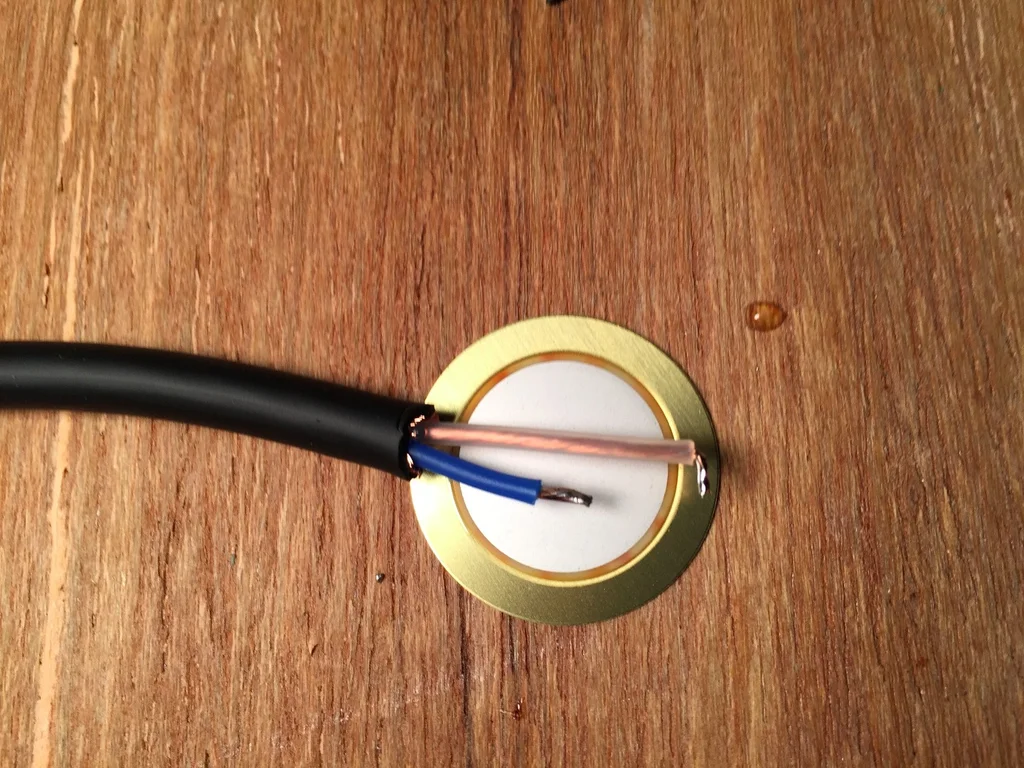
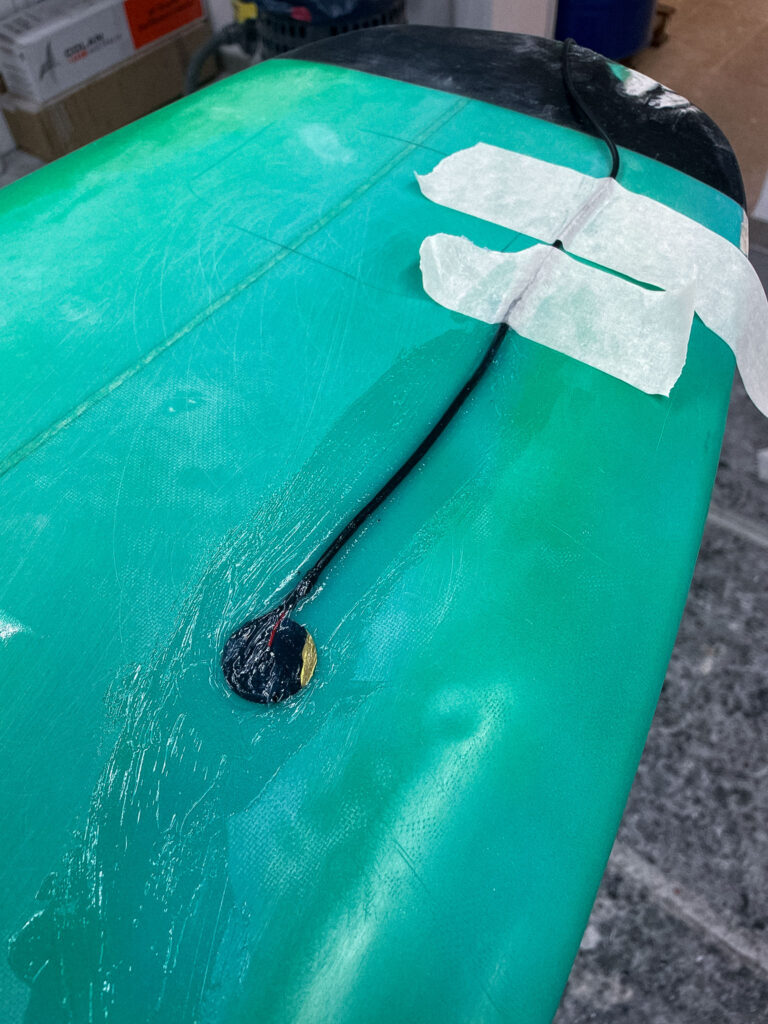
Looking at the building phase of the protype, Noa Surfboards proposed embedding the piezo disc underneath the front-foot zone of the deck. This area is perfect to capture the movement of the surfer, while not being under strong impact of the bodyweight of the surfer. In order to integrate the microphone in the body of the board a rectangular section of the fiberglass top layer was carefully removed. In the next step the piezo disc was mounted directly to the raw material. To protect the microphone from external impacts and the saltwater multiple layers of fiberglass cloth were laid over the sensor and encapsulate the mic completely.
Another critical technical step was to route the cable from the embedded mic to the waterproof electronics box. Therefore, a narrow channel was drilled on the side of the box for the cable to enter.
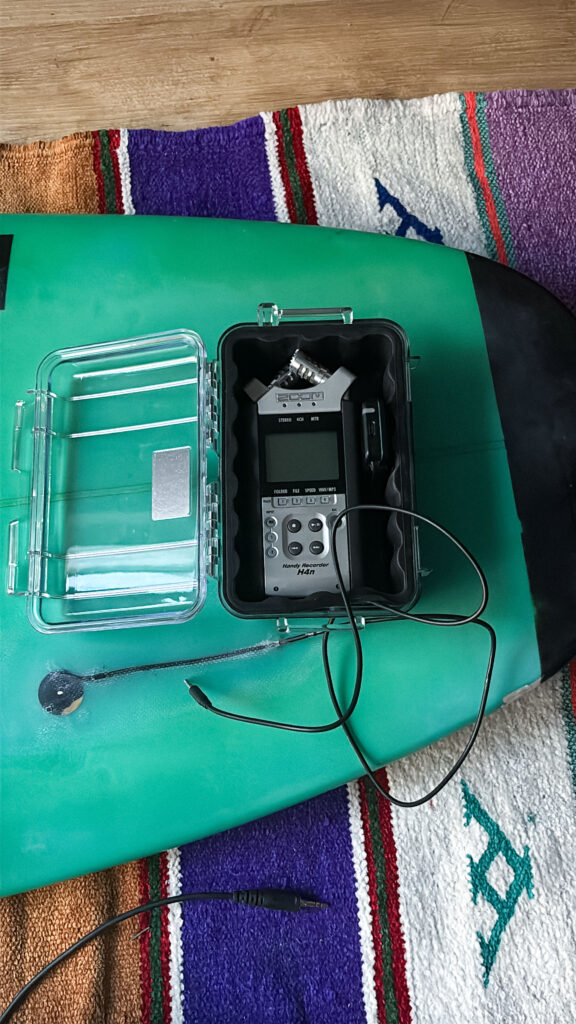
Inside the case, the Zoom H4n recorder and x-IMU3 sensor were suspended in a foam block designed to isolate the electronics from board vibrations and strong impacts.
Before deploying the system in ocean conditions, a controlled test was performed using a surf skate on land in order to structure the synchronization part of the different media in advance. Therefore, the simulation served multiple purposes:
First, to test the stability and functionality of the hardware setup under strong movements
To collect and analyze motion data from surfing-like movements like the cutback using the ximu3 sensor
To test and evaluate the contact microphone’s responsiveness to board interaction and different movement patterns
To practice audiovisual synchronization between footage an external camera setup, the Zoom H4n recorder, the contact microphone and the x-IMU3 motion data.
Therefore, the surf skate was chosen because of its closely representation of the body movement and board rotation then surfing. Especially the cutback movement can be imitated by using a skate ramp.
This testing setup consists of the following tools:
A Carver-style surf skateboard
The x-IMU3 sensor mounted on the bottom of the board to capture movement dynamics
The Piezo contact microphone taped next to the motion sensor on the bottom of the board. After testing the microphone was placed in the middle of the skateboard deck in order to capture the movement of both axes of the board at the same amount of loudness. Placing the microphone closer to the wheels of the board would result in much more noise in the recording due to the internal rotation of the axes.
The Zoom H4n recorder was help in the hand of the skater and was connected to closed over ear headphones.
Using the external film camera Sony Alpha 7iii the whole test was captured. This additional recording was helpful later in the synchronization part.
The board was ridden in a skate ramp simulating the composition of the wave. ON the top of the ramp the cutback movement can be executed.
At the start of the recording session, all devices were synchronized through a short impulse sound (hitting on the board) recorded on all three devices: Zoom, GoPro, and x-IMU3. The single surf skate tackes lasted approximately 2 minutes of recording and were repeated multiple times. The data recorded consists of:
accelerometer, gyroscope, orientation from the x-IMU3
The surf skate test validated the concept and highlighted important considerations:
Movement-based sonic gestures are highly expressive and usable for composition;
Vibration sensitivity of the contact mic is sufficient for detailed sound capture;
The sync strategy will work equally well in ocean sessions with minor adjustments;
Battery and storage life are adequate for short-to-medium-length surf sessions;
Cable insulation and structural mounting are durable under stress.
This test confirmed the system’s readiness for its full application in Morocco, where ocean sessions will build upon the structure and learnings of this simulation.
The motivation of using different methodes to do the sound design for this surf movie comes from a lack of surf movies and documentaries that use sound design based on field recordings in this area. With this project I want to showcase how many layers of realness can be added to a surf documentary by using on set field recordings paired with sensor data to convey this experience of surfing on a much deeper level. Therefore, the Sound design of this project is not seen as a post-processing effect but as an integral part of how motion and environmental interaction are perceived. The core idea and mission is to treat the surfer’s movement as a gestural performance and dance that modulates audio based on what is actually happening in the image. With the help of Pure Data, a modular synthesis environment, the motion data is mapped on audio processing parameters to underline this immersive and expressive sonic storyline.
Starting with the different sound design inputs that will be used in the Surf film, the primary audio material comes from a contact microphone imbedded in the surfboard. These are real, physical vibrations, bumps, hits, and subtle board resonances create the basic sonic texture of the piece. These raw recordings are used as:
Input for audio modulation
Triggers or modulating sources for effects like pitch shifting, filtering, and delay
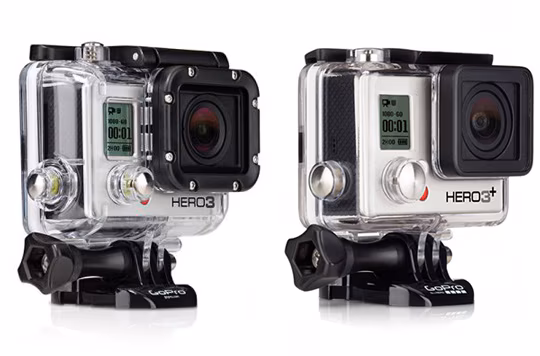
Second core sound source is the Zoom H4n recorder mounted on the nose of the board. Here the focus lies strongly on field recordings in order to capture the raw sonic experience of the surf session. Furthermore, the data of the sensor will be adjusting the soundscape, translating raw data into modulation for sound design. Also, the internal audio of the GoPro Hero3 will be used to synchronize data in post processing and the recorded video will be a visual representation of the full experience.
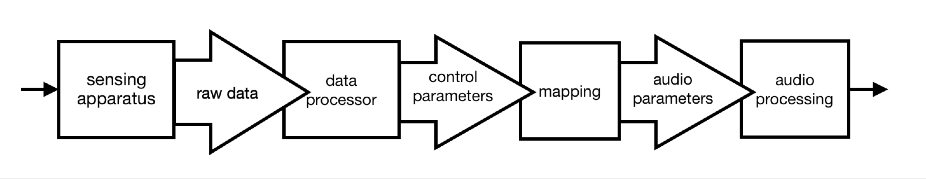
Looking at the mapping part of the project, the x-IMU3 sensor provides multiple streams of data like acceleration, gyroscopic rotation, and orientation, that are mapped to sound parameters. Each data of movement is used differently:
Acceleration (X, Y, Z) modulates filter cutoff, grain density, or reverb size. Here the exact usage of modulation parameters will be discussed in the postproduction phase of the project.
Angular velocity controls pitch shift, stereo panning, or feedback loops.
Orientation (Euler angles or quaternion) is used to gate effects or trigger events based on the recorded movement thresholds.
The mappings will be adjusted in the following process and are designed to reflect the physical sensation of surfing in the most accurate way possible. Looking at the movement that is most important, the Cutback move, here a sharp move will translate in a spike in angular velocity. This spike can be translated in a big glitch sound effect. Here more research and test will be needed in order to find the best parameter settings for this modulation.
One possibility of audio modulation in Pure Data will be the granular synthesis. It allows to create evolving textures from short segments, like grain noise of the recorded contact mic sounds. Further examples of possible modulations:
Grain size – (short = more textural, long = more tonal)
Looking at the storyline of the surf documentary one can pinpoint the following narrative structure of the sound design:
Before the surf / coastline of Morocco:
To catch the stressful coastal live of Morocco field recordings will be used to translate this feeling of stress, being overwhelmed (red mind). Here the recordings will be done by the Zoom H4n recorder.
Entering the water/ Paddling Phase:
As the surfer enters the water the stressful coastal sounds fade, and the listener will be surrounded by the sound of the ocean. Here it is important to translate the soundscape, which the surfer actually perceives. No further sound modulation is added here. The theory of the blue mind points out how much the noise of the ocean can regulate the nervous system. This will be translated to the sound design of this section of the movie, giving the listener the feeling of being in the present.
Catching the wave:
As soon as the surfer catches the wave and manages to stand up on the wave the dramaturgical main part of the composition begins. This will be initialized by a strong impact on the contact microphone, triggered by the jump of the person. This will also be measurable on the motion sensor with increase of speed. At this point of the composition the sound modulation starts.
Riding the wave / Cutbacks: At this stage of the movie the person feels a sensation of absolute presence and high focus. This natural high state gives a feeling that is hardly describable in words or images. Here the Sound Desing carries the listener through. Granular synthesis, stereo modulation and filtered resonance reflecting the physical and spiritual intensity in this moment. Here the tool of sound modulation is chosen intentionally to also create a contrast between the paddling stage of the movie.
End of the riding / Hit of the wave:
In the end of the movie the surfer will fall in the water creating a strong and impactful ending of the whole experience. This sudden cut will be auditory through a big amount of noise of the underwater recording. Nothing more than muffled wave sounds will be heard to empathize the feeling of being underwater. Sonic textures will decay leaving with a feeling of stillness after this intense movement.
With the help of this sonic structure both the physical and emotional journey of a surf session is captured and represented.
Considering the final sound piece a stereo format is the first output. Also including spatial depth will be achieved through modulation and stereo imaging based on the recorded motion data. Volume normalization and dynamic range control are applied in Davinci Resolve, however by respecting the intention of the sound piece to add less additional audio modulation by a software and only using techniques of audio manipulation using the sensory data.
The final audio and movie is intended for headphone or multichannel playback in an installations or possible surf exhibitions.
Moving forward, in this section the documentation of the workflow used to playback recorded x-IMU3 motion sensor data and visualize it as a dynamic graph in Pure Data, is shown. The goal here was to analyze the movement of two specific flips along the X-axis. Therefore a few seconds of this rotation were recorded and then read through the python script, send to PureData and here printed in a visual graph. The confirmation of the accuracy was done through multiple validation layers.
First, data was captured using the x-IMU3 inertial measurement unit. During the recorded session, the sensor was physically maneuvered to do two flips along its X-axis. Then, this data was saved internally by the sensor into a binary format with the extension. ximu3. In order to later find this file again, it was named XIMUA_0005.ximu3 and was stored on an external drive.
Second step was to decode and transmit the recorded motion data. Therefore, I used a Python script named ximu2osc.py. This script was written to read both live and recorded data and transmit it via the Open Sound Control (OSC) protocol. This python script uses the official ximu3 Python library to do file decoding, and the python-osc library for sending OSC messages.
The python script was executed using the following command in the terminal:
Using this script the playback of the sensor recording get initialized by naming the .ximu3 file as input. Looking at the command, the -p argument sets the OSC port to 9000. The -H argument points out the destination IP address, which in this case is 127.0.0.1. The Python script, in the next step, reads and decodes the binary sensor data in real time. Next step, the formatted OSC messages gets send using a clearly defined path.
Focusing on the receiving end, a Pure Data (Pd) patch was created to receive and interpret the data. This patch was configured to listen on port 9000 and processes the incoming OSC messages with the [netreceive -u -b 9000] object. It is capable of receiving UDP packets in binary format. The output from netreceive was then connected into [oscparse] object. OSCPARSE is responsible for decoding incoming OSC messages into usable Pd lists.
[list trim] was introduced in the patch to remove any resisting selectors. As the next step, a set of [route] objects were implemented. There were placed to filter out the gyroscope data, specifically the values from the X, Y, and Z axes. In this process a hierarchical routing structure was used. The first one: [route intertial], followed by [route gyroscope] and finally [route xyz]. The final values were then unpacked using [unpack f f f] to split them into three float values (X, Y, Z). For this test, only the X-axis values were needed.
To have a visual representation of the X-axis values in real time, an array named array1 was created. It functions as a scrolling plot reading the incoming rotation data. This was executed by assigning each X value to a new index in the array [tabwrite array1]. A simple counter system was built using [metro] to write the position in the array. [+ 1], [mod 500]. The [metro] object gets triggered at a 500ms interval, which, in this case served as the sampling rate of the graph. This counter also loops over a fixed range of 500 steps. This is how the circular buffer was build. Now, each new value is being stored in a float object [f] and sent via [s x-index] to its matching [r x-index].
With using this setup, it is possible to visually plot the continuous stream of X-axis values into the array. The result is a dynamic visualization of the sensor’s movement over time. Looking at the playback of the recorded. ximu3 file, the two flips performed on the X-axis are strongly stown as spikes in the plotted graph. This provides a real representation of the motion of the flip along the X-axis. In addition, all values were also printed to the Pd console in order to verify and debugging purposes.
Next step, to ensure the accuracy of the visualization, I compared the received values in three different ways. First, I monitored the terminal output of the Python script. Here every OSC message that was being sent was printed out, including its path and its matching values. Secondly, I checked the values listed inside Pure Data. Here the numbers were compared with the one from the terminal. Thirdly, I opened the. ximu3 file in the official x-IMU3 GUI and therefore exported the data as a CSV file. Analyzing the resulting file Inertial.csv, the “Gyroscope X (deg/s)” column was detected and housing the same values then printed in the terminal, in Pure Data and visually on the graph. This lets me confirm, that the sensor data was transmitted consistently across all three layers: the original file, the terminal stream, and in the end, the Pd visualization.
In conclusion, this test showcasts a successful connection between recorded sensor movement and its visual representation using an OSC streaming data pipeline. A clearly structured, repeatable method was used to analyze a specific gestures or physical event, recorded by the sensor. Furthermore, the system is adaptive and can be easily adjusted to visualize different values. It also sets the ground stone for other possibilities in sound design and audio adjustment in the further process.
In addition to decoding files using the x-IMU3 GUI, this project also focuses on utilized the Python library provided by x-io Technologies. Here sensor data can be streamed directly from the device via an USB connection. After successfully installing the ximu3 package with pip3 install ximu3, the provided example scripts of the GitHub repository’s Examples/Python were being used. In particular the usb_connection.py. (https://github.com/xioTechnologies/x-IMU3-Software) In the next step, after installing the ximu3 Python package via pip3 install ximu3, the script usb_connection.py was located and run from the external SSD directory /Volumes/Extreme SSD/surfboard/usbConnection.
To execute the script, the following terminal command was used: python3 /Volumes/Extreme\ SSD/surfboard/usbConnection/usb_connection.py
verenaschneider@Verenas-MacBook-Pro-10 usbConnection % cd “/Volumes/Extreme SSD/surfboard/usbConnection” python3 usb_connection.pySearch for connections? [Y/N] Y Found x-IMU3 64F619DC 615439702 us 0.031 g 0.532 g 0.434 g 615441462 us -0.321 deg/s -0.054 deg/s -0.063 deg/s -0.019 g -0.008 g 1.000 g 615441462 us 0.262 -0.965 -0.003 0.965 0.262 0.019 -0.017 -0.008 1.000 615441462 us -0.472 deg 0.975 deg 74.777 deg 615446047 us -0.009 g 0.552 g 0.333 g 615446814 us 0.163 a.u. -0.472 a.u. -0.401 a.u. 615451474 us -0.076 deg/s -0.100 deg/s -0.005 deg/s -0.017 g -0.009 g 1.000 g 615451474 us 0.263 -0.965 -0.004 0.965 0.263 0.019 -0.017 -0.008 1.000
The next step is successfully executed once the x-IMU3 is detected. Here the user is prompted whether to print data messages or not. After enabling this, the terminal now displays live sensor data. This data set includes quaternions, Euler angles, gyroscope, and accelerometer data. It is noticeable, that this method bypasses the GUI and provides a direct access to sensor streams. This step enables a more flexible integration and a more advanced data mapping setup.
The full Python architecture includes modular scripts like connection.py, usb_connection.py, and helpers.py. These are handling low-level serial communication and parsing. This additional access pathway expands the projects versatility and opens doors for a more experimental workflow (x-io Technologies, 2024).
The received OSC data is interpreted using a custom Pure Data patch (imu3neuerversuch22.04..pd), which serves as a bridge between sensor data and visual representation of the data. This patch listens for incoming OSC messages via the [udpreceive] and [unpackOSC] objects, parsing them into sub-addresses like /imu3/euler, /imu3/acceleration, and /imu3/gyroscope.
Each of these OSC paths carries a list of float values, which are unpacked using [unpack f f f] objects. The resulting individual sensor dimensions (e.g., x, y, z) are then routed to various subpatches or modules. Inside these subpatches, the values are scaled and normalized to fit the intended modulation range. For example:
Euler angles are converted into degrees and used to modulate stereo panning or spatial delay.
Z-axis acceleration is used as a trigger threshold to initiate playback or synthesis grains.
Gyroscope rotation values modulate parameters like filter cutoff or reverb depth.
Additionally, [select] and [expr] objects are used to create logic conditions, such as identifying sudden peaks or transitions. This setup allows the system to treat physical gestures on the surfboard—like standing, carving, or jumping—as expressive control inputs for audio transformation.
The modular structure of the patch enables quick expansion. New OSC paths can be added, and new sound modules can be integrated without rewriting the core logic. By structuring the patch in this way, it remains both maintainable and flexible, supporting future extensions such as machine learning-based gesture classification or live improvisation scenarios.
This technical design reflects a broader trend in contemporary media art, where real-world data is used not just for visualization but as a means to dynamically sculpt immersive audio experiences (Puckette, 2007).
The data pipeline is structured in three different phases: acquisition, post-processing, and sonification. The first part, Acquisition includes independent capturing of audio (Zoom H4n, contact microphone), motion (x-IMU3), and video/audio (GoPro Hero 3). Then, in the next step, post-processing uses the x-IMU3 SDK to decode the recorded data. This data is then send via OSC to Pure Data and is there translated into its different parameters.
The sonification and audio transformation are carried out also using Pure Data.
This architectural structure supports a secure workflow and easy synchronization in post.
Motion data was recorded onboard the x-IMU3 device. After each session, files were extracted using the x-IMU3 GUI and decoded into CSVs. These contain accelerometer, gyroscope, and orientation values with timestamps (x-io Technologies, 2024). Python scripts parsed the data and prepared OSC messages for transmission to Pure Data. The timing issue is faced with the help of synchronizing big movements in rotation or acceleration during the long recording all devices. (Wright et al., 2001).
The Audio recorded from the contact mic is a simple mono WAV file and is Pure Data and later Davinci Resolve for the audio video final cut. Looking at the recordings, the signal primarily consisted of strong impact sounds, board vibrations, water interactions and movements of the surfer. These recordings are used directly for the sound design of the movie. During the main part of the movie, when the surfer stands on the board, this audio will also be modulated using the motion data of the sensor reflecting on the gestures and board dynamics. (Puckette, 2007; Roads, 2001).
Having all this different not in synchronized time recorded data files leaves a great question of exact synchronization. Therefore, a test was conducted which will be explained in more detail in the section: 10. SURF SKATE SIMULATION AND TEST RECORDINGS. The movement of surfing was simulated using a surf skateboard, on which a contact microphone was mounted on the bottom of the deck. In addition to the microphone also the motion sensor was placed next to the microphone. Now, having the image and the two sound sources (contact microphone and audio of the Sony camera) I could synchronize both recordings in post-production using Davinci Resolve. Here the main key findings were the importance of great labeling of the tracks and clear documentation of each recording. During the final recordings on the surfboard the GoPro Hero 3 will act as an important tool to synchronize all the different files in the end. Another audio output of the GoPro acts as an additional backup for a more stable synchronization workflow. Here test runs on the skateboard are essential to be able to manage all the files in post-production later. (Watkinson, 2013).
The motion data recorded on the ximu3 sensor is replayed on the GUI of the sensor and can then send the data via OSC to Pure Data. Parameters such as pitch, roll, and vertical acceleration can then be mapped to different variables like grain density, stereo width, or filter cutoff frequency. (Puckette, 2007).
All tools are selected based on compatibility and possibility to record under this special conditions. The toolchain includes:
x-IMU3 SDK and GUI (macOS) for sensor decoding
Python 3 for OSC streaming and data parsing
Pure Data for audio synthesis
DaVinci Resolve for editing and timeline alignment
This architecture functions as the basic groundwork of the project setup and can still be expanded using different software’s of python code to add more individualization during different steps of the process. (McPherson & Zappi, 2015).
Looking deeper into the Synchronization part of the project, challenges arrise. Because there is no global time setting for all devices, they have to run individually and then be synchronized in post-production. Here working with good documentation and clear labels of each track helps to get a good overview. Especially the data of the motion sensor will have a lot of information and needs to be time aligned with the audio. Synchronizing audio and video, however, is for sure a smaller challenge, because of the multiple different audio sources and the GoPro footage. A big impact or a strong turn of the board can then be mapped to the audio and video timeline. The advantage of one long recording of a 30 min surf session is for sure, that the possibility for such an event increase over time. Tests with the skateboard, external video and audio from the contact microphone were already successful.
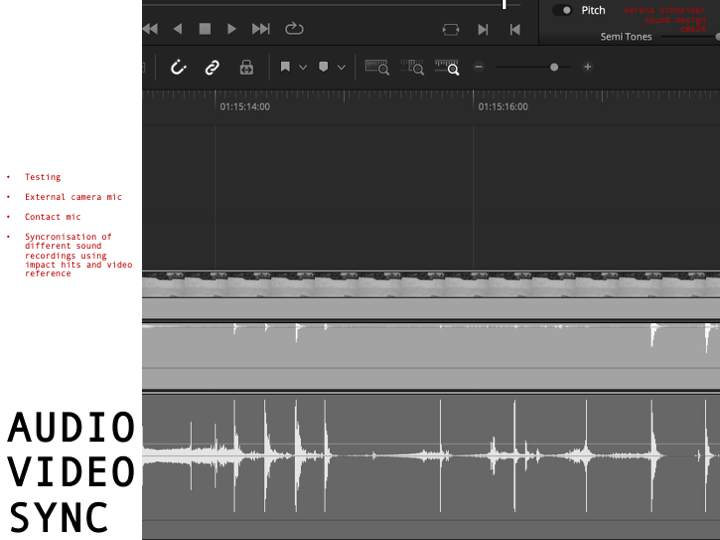
On the image the setup in Davinci Resolved shows the synchronization of the contact microphone (pink) and the external audio of the Sony Alpha 7iii (green). Here the skateboard was hit against the floor in a rhythmical pattern, creating this noticeable spikes in audio on both devices. This rhythmical movement can also be seen on the XIMU3 sensor.
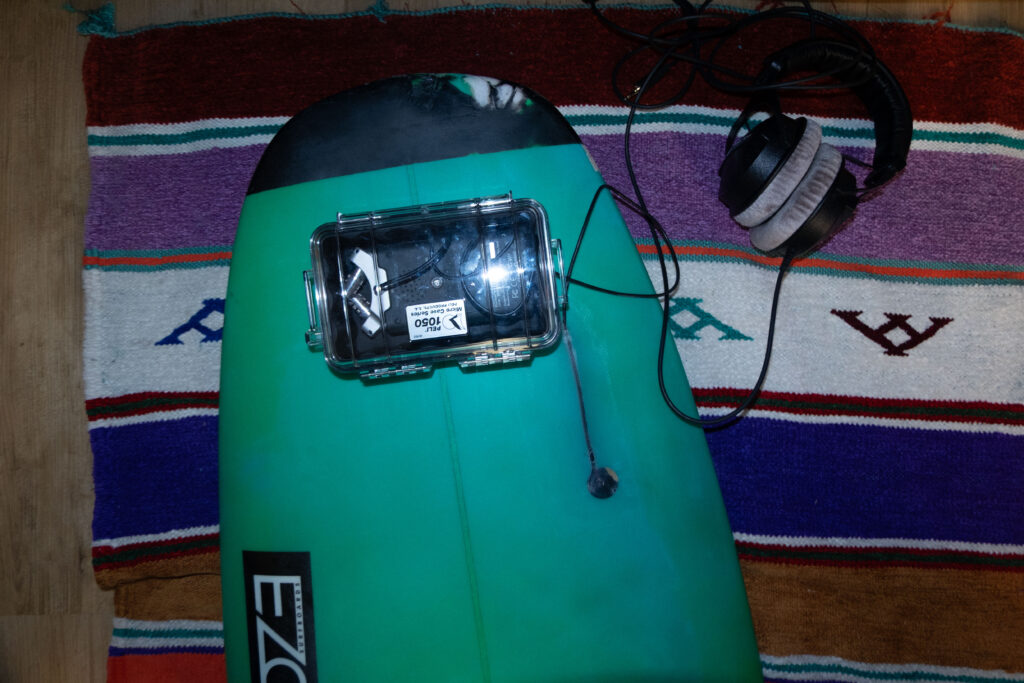
1.1. OVERVIEW OF THE SETUP The hardware setup of this project was developed to function and withstand under the challenging environmental conditions typical for surfing. Therefore, the full equipment needs to not only be made for saltwater exposure, but also be strong enough to handle strong hits and impacts. The sunlight, and hot temperatures also act as another impactor. Therefore, building components were selected based on their stability, mobility, and compactness. The complete system includes a waterproof Pelican 1050 case mounted on the surfboard, containing a Zoom H4n audio recorder, a piezoelectric contact microphone and an x-IMU3 motion sensor. An externally mounted GoPro Hero 3 camera records video and sound. The interior of the Peli case is filed with protective foam to minimize shock and mechanical disturbance. Concluding, the arrangement was optimized to allow a smooth operation during surfing while maintaining robust data acquisition.
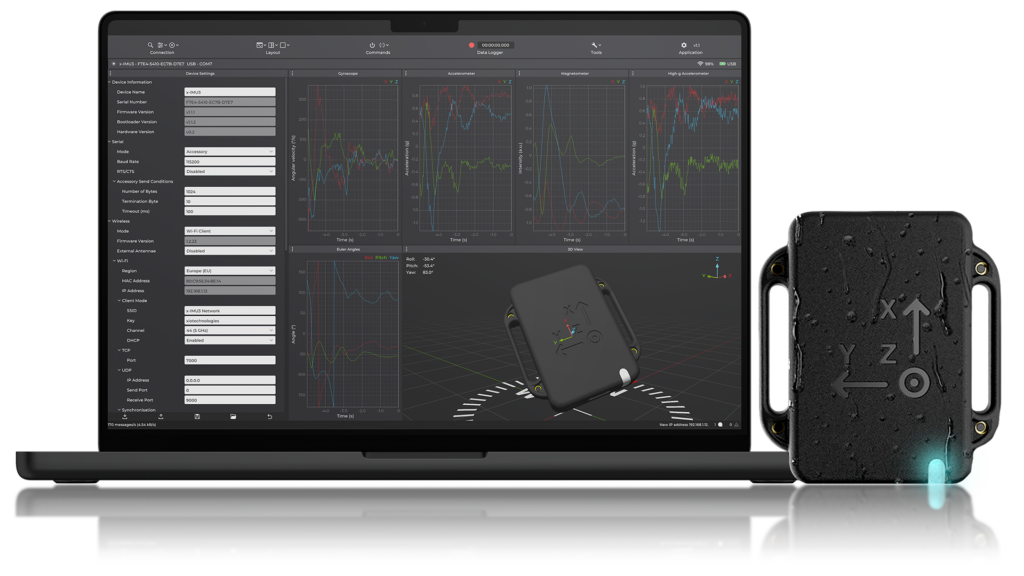
1.2. MOTION SENSOR – X-IMU3
The x-IMU3, was developed by x-io Technologies. It is a compact inertial measurement tool (IMU) capable of logging tri-axis accelerometer, gyroscope, magnetometer and orientation data with timestamp precision. For this application, the sensor operated in standalone mode and will be charged by an external small power bank later retrieval. After each recording session, the x-IMU3 GUI and SDK were used to decode. ximu3 binary files into structured CSV datasets (x-io Technologies, 2024). These data streams are then available for the synchronization part with audio and video recordings. Furthermore, these recorded values will be used to manipulate the recorded audio using Pure Data.
The x-IMU3 sensor was selected due to its reliability, sampling rate of up to 500 Hz, and OSC-compatible output structure. This enables later integration with sound synthesis software’s in the later process. The sensor is placed in the box cushioned within protective foam in the Pelican case to minimize noise artifacts caused by board vibration.
1.3. CONTACT MICROPHONE – PIEZO DISC In order to add another dimension to the sound recording by capturing board vibrations and internal mechanical changes, a piezoelectric contact microphone was mounted beneath the surfboard wax layer, at the right side of the nose, near the front foot position. Unlike traditional microphones, piezo elements record vibrations through physical material contact, making them suitable for capturing impactful sound events. Also, due the good implementation movements of the surfer on the board are recorded very well. The sensor is routed to the case using a sealed cable channel and insulation to prevent water from getting in the box or inside the board. This microphone setup allows for the recording of impactful events such as hits, flex, and frictional interactions between the board, the water and the surfer. These signals, together with the recordings of the zoom, form the primary audio source used in the sonic interpretation of the surf session. This implementation of a piezo mic in a surfboard has not been done or documented before and is therefore an innovative approach which is of course interesting for sound engineers, as well as surfers and surfboard builder (Truax, 2001).
1.4. AUDIO RECORDER – ZOOM H4N The audio data was recorded using a Zoom H4n Handy Recorder, configured to capture a mono signal from the contact microphone. The recorder was selected for its portability, sound quality (24-bit/44.1 kHz), and dual XLR/TRS inputs. It was housed inside the Pelican case using closed-cell foam to dampen mechanical noise. Battery-powered operation and SD card storage enabled autonomous recording during mobile sessions. Gain levels were calibrated before each session to preserve signal integrity and prevent clipping. The system was designed to ensure consistent signal acquisition even under dynamic surf conditions (Zoom Corporation, 2023).
1.5. VISUAL SYNCHRONIZATION – GOPRO HERO 3 To also have a video output of the surf session, GoPro Hero 3 camera is mounted at the board’s nose. This video material served as both documentation and reference for synchronization. Here, the synchronization of different audio sources and the sensor data is challenging but will made easier with having audiovisual references. For example, a double tapping on the board can help synchronize image to sound. The GoPro’s audio, while limited in quality, served as another layer reference for alignment. In addition, the video recordings serve also as a tool to analyze body posture, movement patterns, and spatial context (Watkinson, 2013). The surf movie will be consisting of many shots taken by the GoPro and will support the surf film with an immersive camera angle.
1.6. ENCLOSURE AND MOUNTING – PELICAN CASE 1050 The Zoom Recorder, sensor, power bank and cables of the contact microphone are enclosed in a Pelican 1050 Micro Case. This model was selected for its IP67-rated waterproof sealing, shock resistance, and small form, making it not too bulky on the board, but still big enough to fit all the necessary equipment. Moving forward, the case is mounted to the surfboard using strong glue and surfboard wax and is incorporated in the general body of the board. In order to connect the contact microphone from outside to the inside, one hole was made in the box. This hole is again sealed with silicone caulk to make it leak and saltwater proof.
Inside, the box a special Peli foam is inserts to prevent internal motion and a fixation for the sensor and the recorder. The case and cabling configuration underwent field testing, including simulated riding on a surf skate and controlled submersion for a specific amount of time, to ensure no leakage will occur during recording
– The Emotional Vision Behind Surfboard Sonification
Surfing is more than just a sport. For many surfers, it is a ritual, a form of meditation, and an experience of deep emotional release. There is a unique silence that exists out on the water. It is not the absence of sound but the presence of something else: a sense of connection, stillness, and immersion. This is where the idea for “Surfboard Sonification” was born. It began not with technology, but with a feeling. A moment on the water when the world quiets, and the only thing left is motion and sensation.
The project started with a simple question: how can one translate the feeling of surfing into sound? What if we could make that feeling audible? What if we could tell the story of a wave, not through pictures or words, but through vibrations, resonance, and sonic movement?
My inspiration came from both my personal experiences as a surfer and from sound art and acoustic ecology. I was particularly drawn to the work of marine biologist Wallace J. Nichols and his theory of the “Blue Mind.” According to Nichols, being in or near water has a scientifically measurable impact on our mental state. It relaxes us, improves focus, and connects us to something larger than ourselves. It made me wonder: can we create soundscapes that replicate or amplify that feeling?
In addition to Nichols’ research, I studied the sound design approaches of artists like Chris Watson and Jana Winderen, who work with natural sound recordings to create immersive environments. I also looked at data-driven artists such as Ryoji Ikeda, who transform abstract numerical inputs into rich, minimalist sonic works.
The goal of Surfboard Sonification was to merge these worlds. I wanted to use real sensor data and field recordings to tell a story. I did not want to rely on synthesizers or artificial sound effects. I wanted to use the board itself as an instrument. Every crackle, vibration, and movement would be captured and turned into music—not just any music, but one that feels like surfing.
The emotional journey of a surf session is dynamic. You begin on the beach, often overstimulated by the environment. There is tension, anticipation, the chaos of wind, people, and crashing waves. Then, as you paddle out, things change. The noise recedes. You become attuned to your body and the water. You wait, breathe, and listen. When the wave comes and you stand up, everything disappears. It’s just you and the ocean. And then it’s over, and a sense of calm returns.
This narrative arc became the structure of the sonic composition I set out to create. Beginning in noise and ending in stillness. Moving from overstimulation to focus. From red mind to blue mind.
To achieve this, I knew I needed to design a system that could collect as much authentic data as possible. This meant embedding sensors into a real surfboard without affecting its function. It meant using microphones that could capture the real vibrations of the board. It meant synchronizing video, sound, and movement into one coherent timeline.
This was not just an artistic experiment. It was also a technical challenge, an engineering project, and a sound design exploration. Each part of the system had to be carefully selected and tested. The hardware had to survive saltwater, sun, and impact. The software had to process large amounts of motion data and translate it into sound in real time or through post-processing.
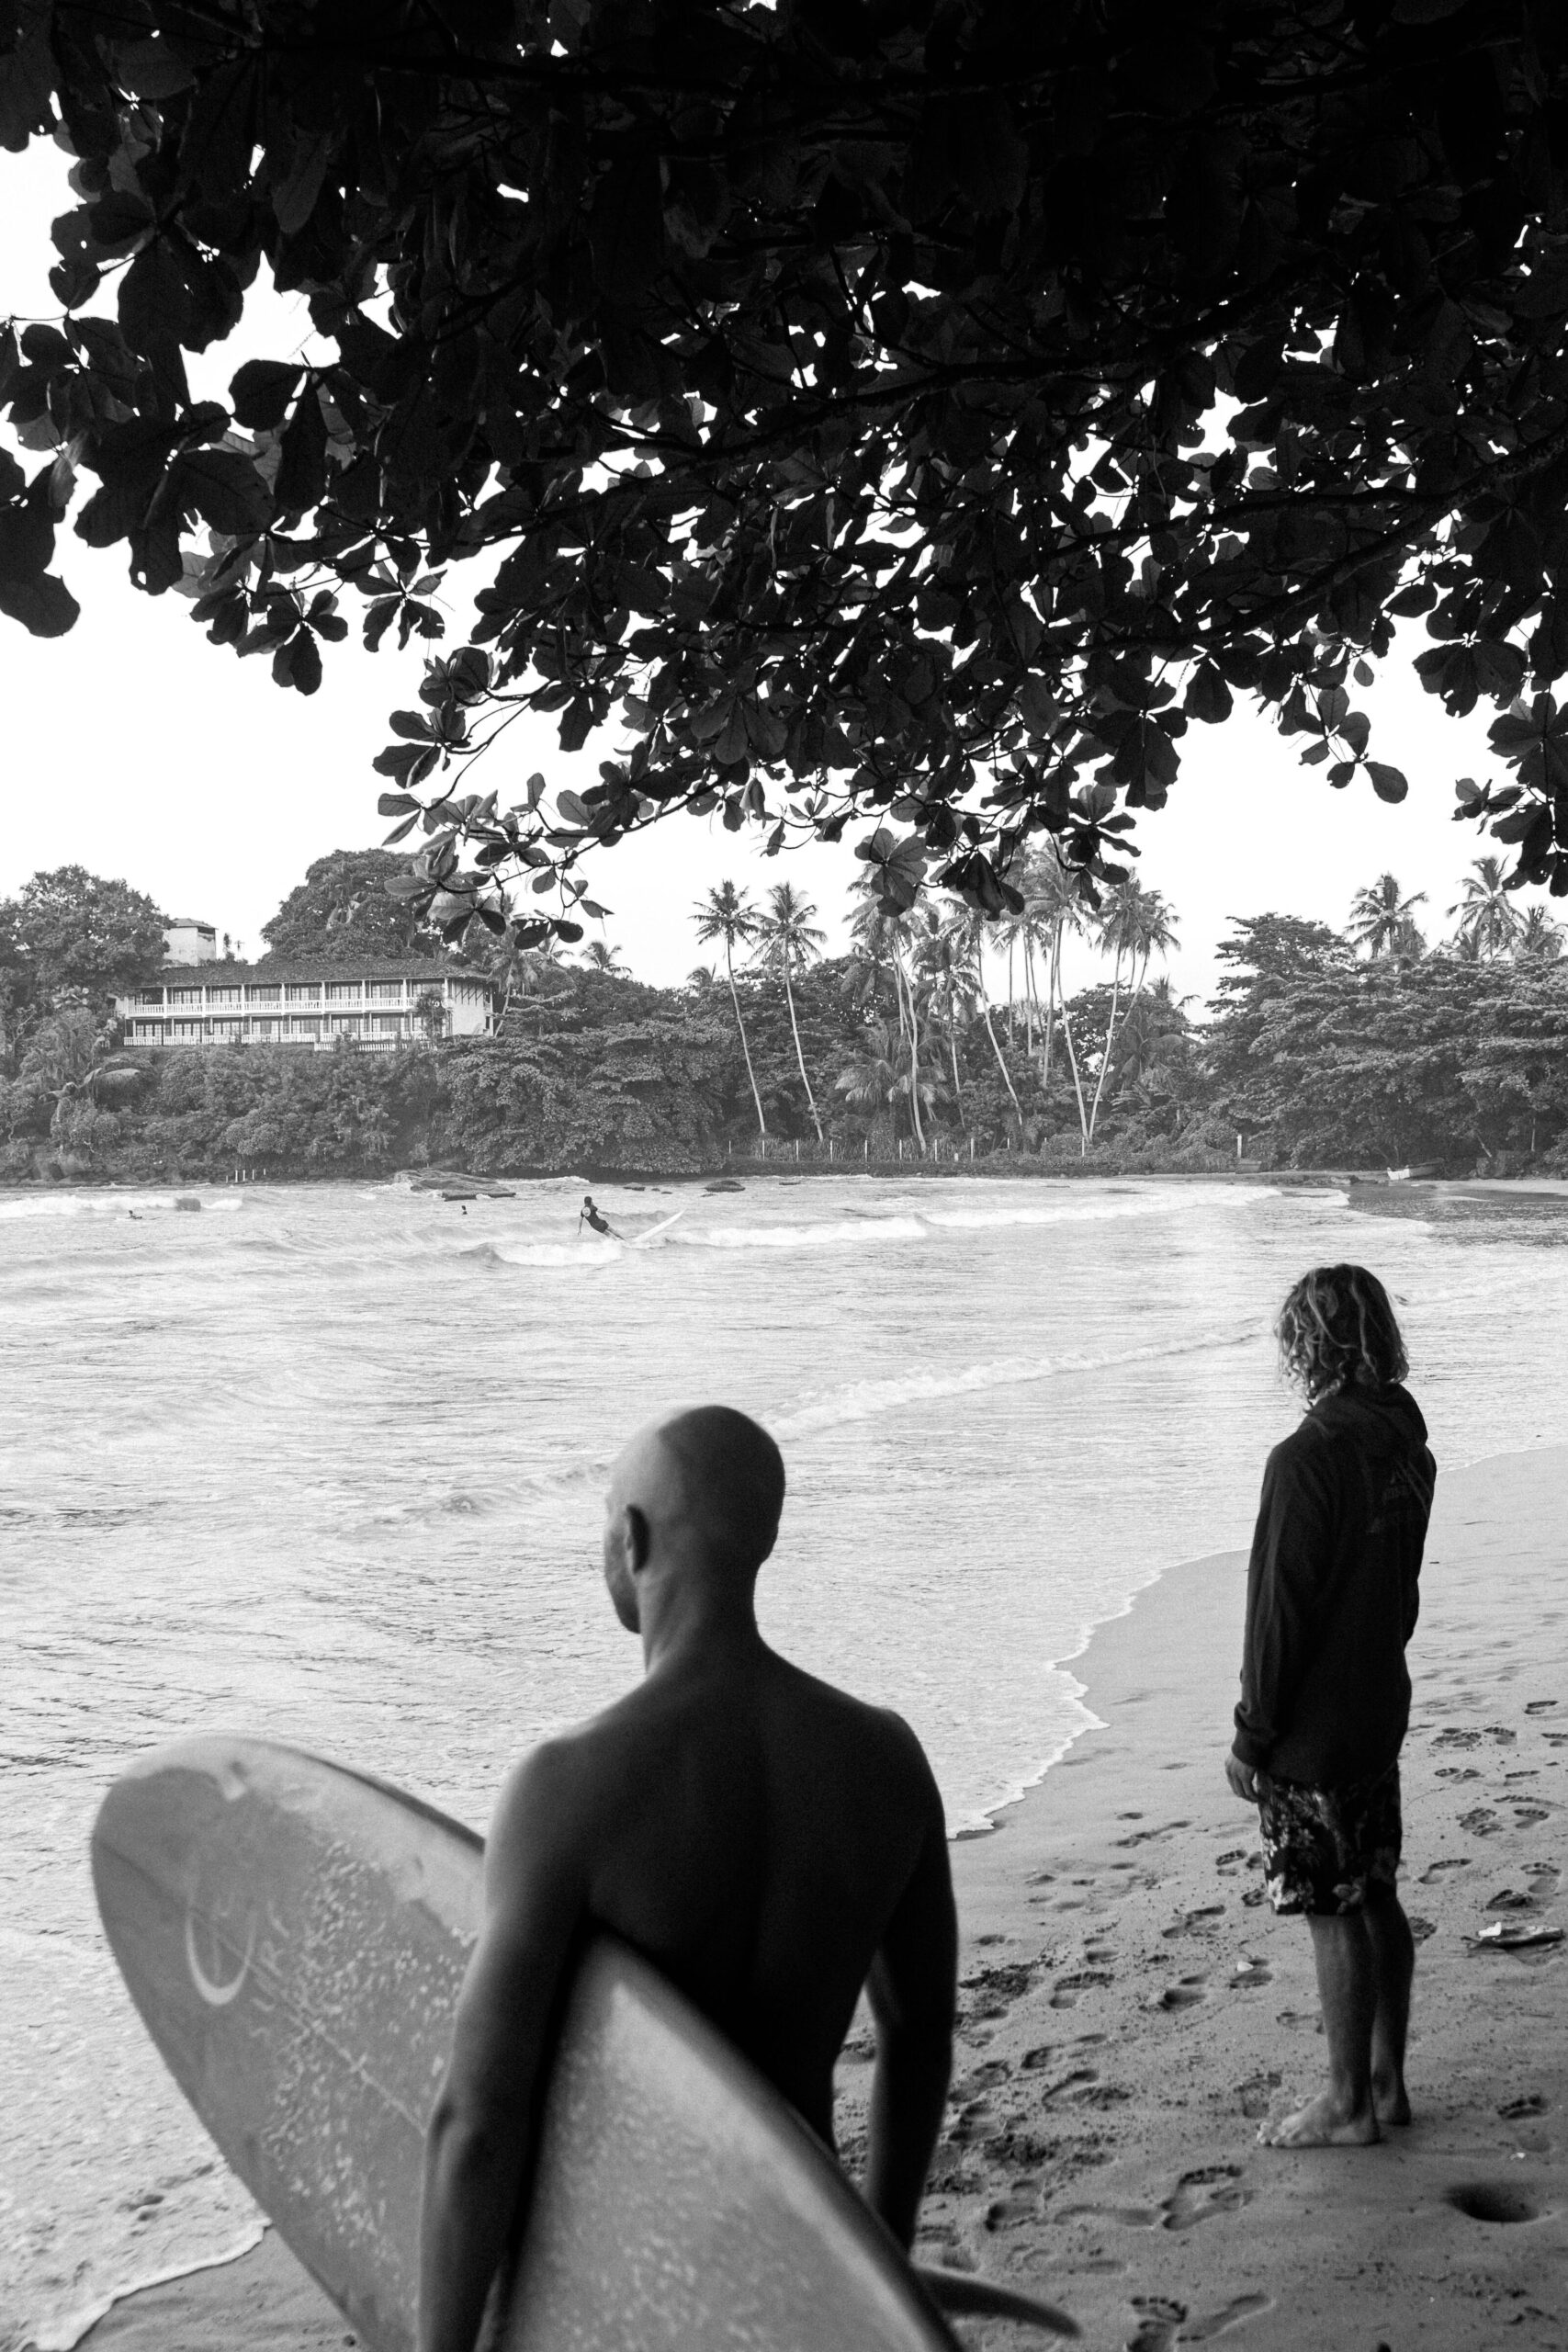
And at the heart of all this was one simple but powerful principle, spoken to me once by a surf teacher in Sri Lanka:
“You are only a good surfer if you catch a wave with your eyes closed.”
That phrase stayed with me. It encapsulates the essence of surfing. Surfing is not about seeing; it’s about sensing. Feeling. Listening. This project was my way of honoring that philosophy—by creating a system that lets us catch a wave with our ears.
This blog series will walk through every step of that journey. From emotional concept to hardware integration, from dry-land simulation to ocean deployment. You will learn how motion data becomes music. How a surfboard becomes a speaker. And how the ocean becomes an orchestra.
In the next post, I will dive into the technical setup: the sensors, microphones, recorders, and housing that make it all possible. I will describe the engineering process behind building a waterproof, surfable, sound-recording device—and what it took to embed that into a real surfboard without compromising performance.
But for now, I invite you to close your eyes. Imagine paddling out past the break. The sound of your breath, the splash of water, the silence between waves. This is the world of Surfboard Sonification. And this is just the beginning.
References
Nichols, W. J. (2014). Blue Mind. Little, Brown Spark.
This project reimagines the surfboard as a data-driven tool, integrating advanced sensors to measure wave interaction, surfer dynamics, and board performance. By merging this scientific data with creative visualization, it opens new dimensions for surfboard shaping, surfer training, and interactive art. Using innovative tools like the x-IMU3 sensor, Pure Data, and TouchDesigner, this project seeks to translate surfing’s raw energy into visuals and soundscapes. The outcome will not only enhance understanding for surfers and shapers but also inspire broader cultural and artistic engagement with the sport. By transforming raw surfing data into emotionally resonant soundscapes and visuals, this project creates a new artistic medium for experiencing the sport, pushing the boundaries of what’s possible in surfing, technology, and art.
The project is divided into four main phases: research and preparation, prototype development and field testing, data processing and visualization, and finalization and presentation. Each phase is designed to ensure the project’s success, from the initial selection of sensors to the final interactive installation. The project also lays the foundation for a future master thesis exploring real-time applications of this technology, with potential commercial applications such as an app or software for surfers and shapers.
02. Introduction and Background
Surfing is a deeply technical sport, where the relationship between the surfer, the board, and the wave is essential. However, much of this interaction remains intuitive, with limited data-driven insights available to inform board design or surfer performance. Current technologies like TRACE and Surflogic GPS focus on external metrics such as speed and location, leaving critical factors—such as board flex, wave impact, and surfer positioning—unexplored.
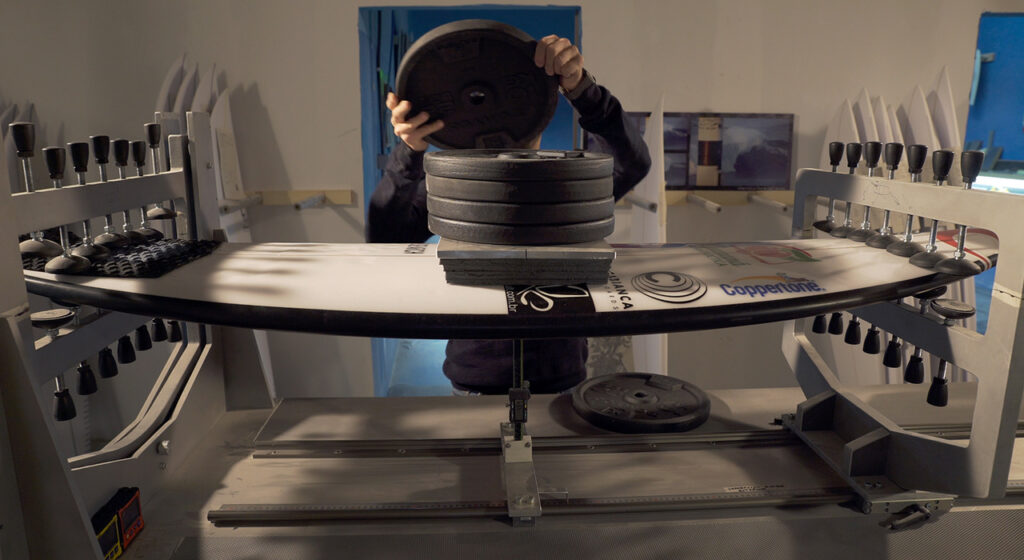
Building on the 2015 TorFlex project by Cabianca Surfboards, this research uses the latest sensor technology to achieve levels of accuracy and data detail that were not done before. Collaborating with professional shapers and surfers, this project will integrate sensors into surfboards, transforming them into tools for analysis, visualization, and artistic expression. While existing technologies focus on performance metrics, this project goes beyond by exploring the artistic potential of surfing. By translating motion, speed, and vibrations into sound and visuals, we aim to create a new way to experience and appreciate the sport.
The project also draws inspiration from other fields, such as computational fluid dynamics (CFD) and sports technology, to ensure a robust scientific foundation. By combining these elements, the project aims to create a surfboard that not only performs well but also provides valuable data for surfers and shapers, while also serving as a medium for artistic expression.
03. Research Question
How can embedded sensors on a surfboard capture environmental and performance data to create auditory and visual representations of surfing?
Sub-Questions:
Can sensor data be used to create emotionally resonant sound and visuals that enhance the surfing experience?
How can a sensor-embedded surfboard improve performance without compromising the traditional surfing experience?
What are the most effective methods for visualizing and sonifying complex surfing data in real-time?
How can the data collected from sensor-embedded surfboards inform future surfboard design and surfer training?
Research on Existing Projects and Technological Advancements
To develop a sensor-integrated surfboard that captures and translates surfing data into artistic visualizations and soundscapes, it is crucial to understand past and ongoing research in this field. Several projects have laid the groundwork for data-driven surfboard innovation, yet technological advancements in machine learning and sensor accuracy now enable deeper exploration and improved results.
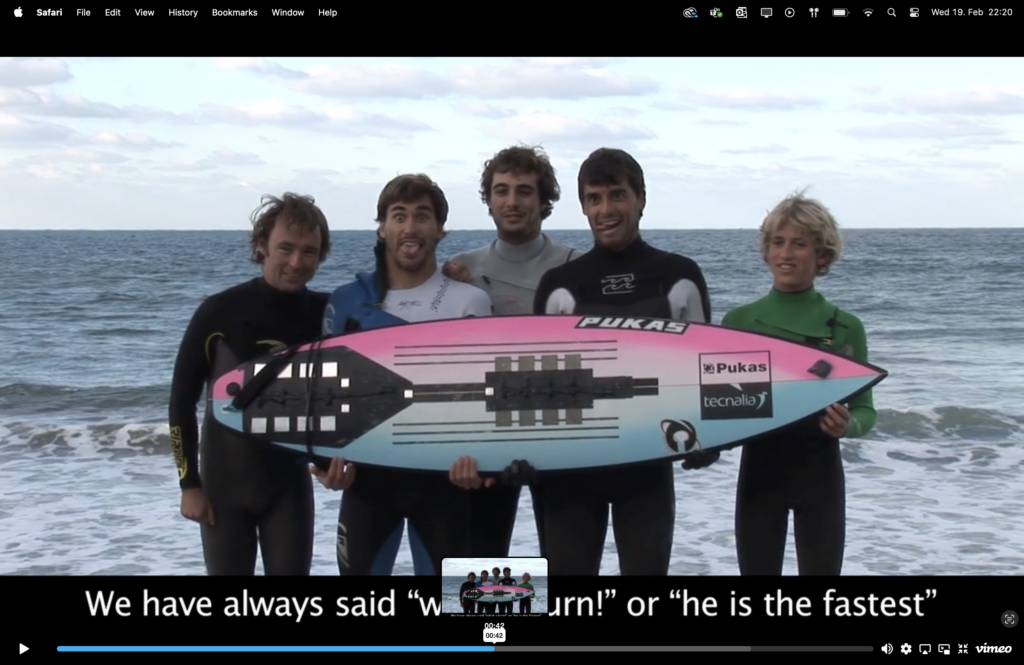
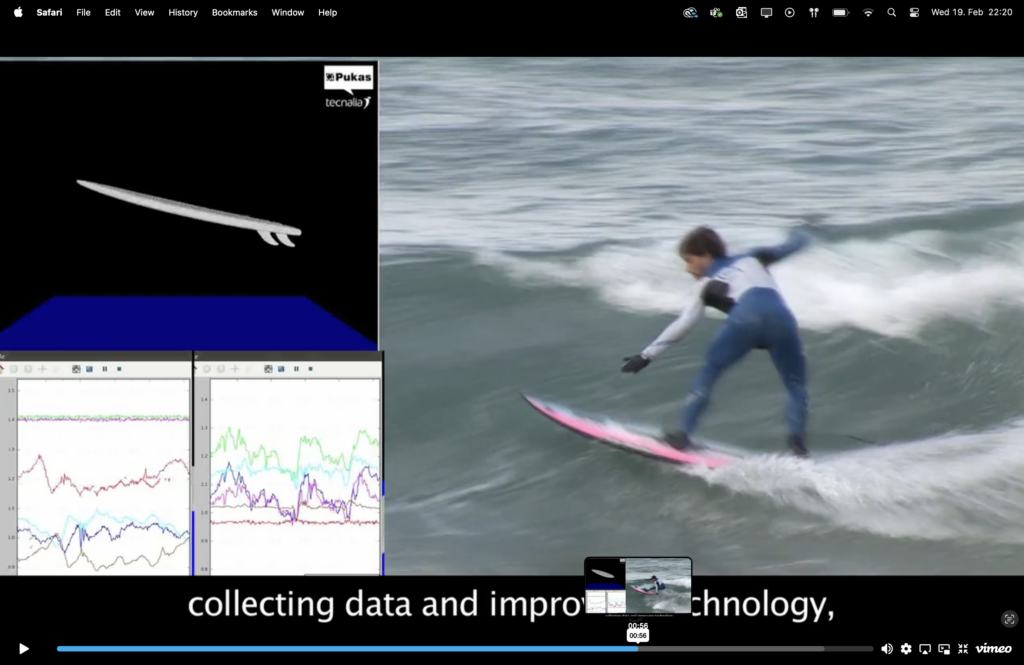
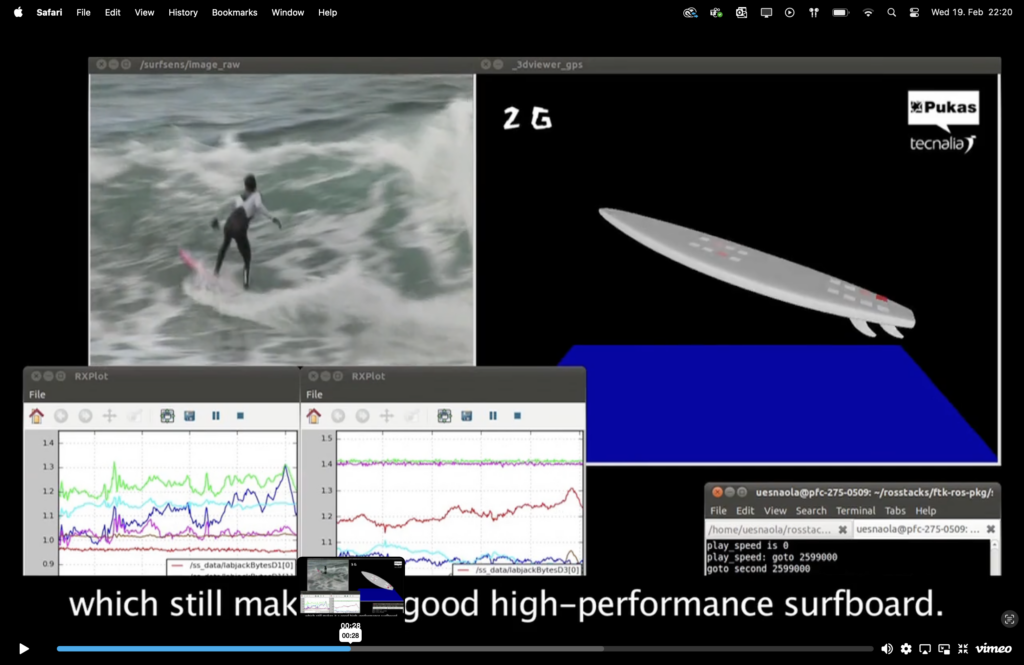
One of the most notable initiatives is the SurfSens Project, a collaboration between Pukas Surf and Tecnalia, which equipped surfboards with pressure sensors, flex sensors, GPS, and accelerometers. The data was recorded via an embedded computer and later analyzed through the Robot Operating System (ROS). While this project provided valuable insights into surfer technique and board performance, it was conducted several years ago, meaning that modern sensors and data analysis tools can now achieve even greater precision and applicability. (https://www.ros.org/news/2011/02/robots-using-ros-surfsens-high-performance-surfboard-with-integrated-sensors.html) – video: https://vimeo.com/20197603
Another compelling approach was explored in the Data-Generated Surfboards Project, which utilized onboard sensors to analyze movement and pressure data. This data informed the creation of CNC-shaped surfboards customized for individual surfers. Though promising, this project remained relatively small in scope and did not fully explore the integration of artistic visualization or real-time data processing. (https://hackaday.io/project/166977-data-generated-surfboards)
The Smartfin Project took a different approach, focusing on environmental data collection. By embedding sensors into a surfboard fin, it recorded ocean parameters like temperature and wave characteristics, transmitting data over cellular networks. While this project contributed to oceanographic research, it did not directly address the dynamics of board performance or surfer technique. (https://blog.scistarter.org/2021/09/with-smartfin-surfers-collect-ocean-data-while-they-hang-ten/)
Insights from Industry and Academic Collaborations
Beyond analyzing existing projects, I have actively engaged with industry professionals to gain deeper insights. I connected with Jonny from Cabianca Surfboards, who previously conducted extensive research into surfboard flex through the TorFlex Project. This system allowed shapers to measure flex, torsion, and vibration in boards to refine their performance. However, Jonny mentioned that the project was halted due to high costs and the complexity of testing different board designs. With today’s more accessible and advanced sensor technology, alongside machine learning applications, I believe these challenges can be overcome, allowing for a more streamlined and scalable approach.
Additionally, I am in discussions with Pukas Surf regarding their past research and potential collaboration. I have applied for an internship with them, which would allow me to gain firsthand knowledge of their findings and integrate their expertise into my project. I am also considering working with Cabianca Surfboards to build and test my prototype surfboard.
Leveraging Modern Technology for a New Approach
While these previous projects laid a strong foundation, I aim to push the boundaries further by integrating:
Machine Learning for Data Analysis: Unlike past projects, I will apply AI models to recognize movement patterns, board flex characteristics, and wave interactions, providing deeper insights into surfer performance and board design.
Real-Time Data Visualization and Sonification: Using Pure Data and TouchDesigner, I will transform surfboard motion and environmental data into an immersive, artistic experience, making the project not just a scientific tool but also an expressive medium.
Advanced Sensor Integration: With support from my university, I will have access to cutting-edge sensors and funding, allowing me to integrate high-precision IMUs (like the x-IMU3), pressure sensors, and hydrophonesinto the surfboard for detailed data collection.
Collaboration with Experts: I will work closely with professors specializing in sensor integration and data visualization, ensuring a rigorous research approach.
Conclusion
By combining elements from previous research projects with modern advancements in machine learning, real-time data processing, and artistic representation, my project will not only provide insights into surfboard performance but also transform raw surfing data into a unique audiovisual experience. Given the rapid evolution of sensor technology and data science, this project has the potential to set a new standard in surfboard innovation, offering both scientific and artistic contributions to the field.
04. Objectives
Primary Objective: To develop a surfboard prototype equipped with sensors that collects performance and environmental data, which is then translated into immersive visual and auditory experiences.
Specific Goals:
Data Collection:
Capture motion, wave interaction, and board dynamics using sensors like the x-IMU3.
Explore additional measurements, including flex, pressure distribution, and surfer positioning.
Visualization and Sound Design:
Use tools like TouchDesigner and Pure Data to transform collected data into compelling visuals and soundscapes.
Ensure the artistic output reflects surf culture, board shaping processes, and wave dynamics.
Collaboration and Practical Application:
Work closely with professional shapers to design boards informed by collected data.
Test the prototype in real surfing conditions with professional surfers.
Documentation:
Document the entire process to establish a foundation for a master thesis and future research, potentially including a commercial application like an app or software for surfers and shapers.
Artistic Expression:
Create an immersive artpiece that allows audiences to experience the rhythm and beauty of surfing through sound and visuals.
05. Methodology
Phase 1: Research and Preparation (Summer Semester 2024)
Sensor Exploration:
Initial trials with x-IMU3 for motion tracking and gyroscopic data.
Investigate additional sensors for pressure mapping and flex analysis.
Collaborations:
Partner with Cabianca Surfboards and other professional shapers for guidance on sensor placement.
Consult with professors specializing in sensor integration and data visualization.
Skateboard Simulations:
Attach sensors to skateboards for controlled land-based testing.
Phase 2: Prototype Development and Field Testing (July–August 2024)
Sensor Integration:
Embed sensors into a surfboard during the shaping process.
Ensure waterproofing and durability for real-world testing.
Maybe also putting sensors on the surfer (shoulders) to capture spesific movement patterns
Field Testing:
Conduct trials in various surf conditions (e.g., small waves, large swells) to gather comprehensive data.
Interview surfers to evaluate the board’s performance and usability.
Phase 3: Data Processing and Visualization (Winter Semester 2024/25)
Data Analysis:
Process collected data to identify patterns in motion, wave dynamics, and surfer-board interaction.
Use tools like Grafana and Kafka for in-depth analysis
Using AI and machine learing tools to define clear patterns and give concret numbers which are important for the surfboard shaper and surfers
Sound Design and Visualization:
Map motion and wave data to sound parameters (e.g., speed → pitch, pressure → amplitude).
Create real-time visual representations inspired by ocean waves and board dynamics using TouchDesigner.
Phase 4: Finalization and Presentation (Early 2026)
Refine the prototype and integrate feedback from field tests.
Create an artpiece and a film showcasing the project.
Prepare final documentation and a pitch for academic and industry presentations.
06. Risk Analysis
Technical Risks:
Sensor failure due to water exposure or impact during surfing.
Data loss or corruption during transmission from the surfboard to the processing unit.
Mitigation Strategies:
Use waterproof and shock-resistant sensors.
Implement redundant data storage and backup systems.
Conduct rigorous testing in controlled environments before field deployment.
07. Stakeholder Engagement Plan
Surfers: Conduct interviews and surveys to understand their needs and preferences. Involve them in field testing to gather feedback on the prototype’s performance.
Shapers: Collaborate with professional shapers like Cabianca Surfboards to ensure the sensors do not compromise the board’s design or performance.
Artists and Technologists: Conduct independent creative research to explore innovative ways to visualize and sonify the data. Immerse myself deeply in the surf culture, studying wave dynamics, board designs, and the aesthetics of surfing to create visually and thematically fitting designs for the project. Experiment with artistic techniques and technologies to develop unique visual and auditory representations that resonate with the essence of surfing.
08. Ethical Considerations
Data Privacy: Ensure that any personal data collected from surfers (e.g., performance metrics) is anonymized and stored securely.
Environmental Impact: Use eco-friendly materials for the surfboard and sensors to minimize environmental harm.
Consider the long-term sustainability of the technology, especially if it were to be commercialized.
09. Broader Impact Statement
Cultural Impact: The project could inspire new forms of artistic expression by merging sports data with creative visualization.
Educational Impact: The technology could be used in educational settings to teach students about data science, oceanography, and sports technology.
Economic Impact: If commercialized, the technology could create new opportunities in the surfing industry, such as data-driven surfboard design or interactive art installations. Helps shapers have a better understanding of their products and supports surfers and professional athlets to improve their interaction with the board.
10. Potential Future Applications
Commercialization: Develop a consumer-friendly app that allows surfers to track their performance and visualize their data in real-time.
Expansion to Other Sports: Adapt the technology for use in other board sports, such as snowboarding or skateboarding.
Scientific Research: Use the data collected to contribute to oceanographic research, such as studying wave patterns or the impact of climate change on surfing conditions.
11. Detailed Evaluation Metrics
Technical Metrics: Accuracy of sensor data (e.g., motion tracking, pressure mapping). Reliability of the system in various surf conditions.
User Experience Metrics: Feedback from surfers on the board’s performance and usability. Audience engagement during the interactive installation.
Artistic Metrics: Emotional impact of the soundscapes and visuals on the audience. Creativity and innovation in the artistic representation of surfing data.
12. Collaboration with Academic and Industry Partners
Academic Collaborations: Work with professors specializing in sensor integration, data visualization, and computational fluid dynamics.
Industry Partnerships: Partner with companies like Cabianca Surfboards for surfboard design and sensor integration. Collaborate with software companies specializing in real-time data processing and visualization tools.
Professional Organizations: Engage with surfing associations to promote the project and gather feedback from professional surfers.
13. Detailed Timeline with Milestones
Phase
Tasks
Timeline
Research & Prototyping
Sensor selection, skateboard testing, collaboration with shapers, and preparation for field testing.
Summer 2024
Field Testing
Integration of sensors into surfboards, data collection, and surfer feedback.
July–August 2024
Data Processing
Analysis of data, sound and visual mapping, and adjustments based on findings.
Winter 2024/25
Final Presentation
Prototype refinement, surf film creation, and academic/public presentations.
Early 2026
14. Budget Justification
Item
Cost Estimate (EUR)
Sensors (x-IMU3, pressure, etc.)
2,500
Surfboard materials
1,500
Software and hardware
1,000
Travel costs
2,000
Miscellaneous
1,000
Total
8,000
15. Conclusion
This project is a pioneering step in merging surfing, technology, and art. By providing real-time data on the interplay between surfers, boards, and waves, it offers transformative possibilities for surfboard design, athletic performance, and cultural expression. The strong technical foundation, combined with artistic innovation, ensures this project’s relevance to both scientific and creative communities. With its potential applications in sports analytics, art, and education, this project is poised to leave a lasting impact on the surfing world and beyond. The Sonic Wave is a project that pushes the boundaries of what’s possible in surfing, technology, and art. By transforming data into sound and visuals, we create a new way to experience and appreciate the sport. The project has the potential to inspire new ways of thinking about the intersection of sports, technology, and art, and I’m excited to see where it takes us.
16. Bibliography
Grand View Research. Surfing equipment market size, share & trends analysis report by product (apparel & accessories, surfing boards), by distribution channel (online, offline), by region (APAC, North America), and segment forecasts, 2021–2028 (2022, accessed 30 Sep 2022). Link.
Elshahomi, A. et al. Computational fluid dynamics performance evaluation of grooved fins for surfboards. MRS Adv. DOI (2022).
Shormann, D. E. & in het Panhuis, M. Performance evaluation of humpback whale-inspired shortboard surfing fins based on ocean wave fieldwork. PLoS ONE 15(4), e0232035. DOI (2020).
Gately, R. D. et al. Additive manufacturing, modeling and performance evaluation of 3D printed fins for surfboards. MRS Adv. 2, 913–920. DOI (2017).
Gudimetla, P., Kelson, N. & El-Atm, B. Analysis of the hydrodynamic performance of three- and four-fin surfboards using computational fluid dynamics. Aust. J. Mech. Eng. 7(1), 61–67. DOI (2009).
Falk, S. et al. Computational hydrodynamics of a typical 3-fin surfboard setup. J. Fluids Struct. 90, 297–314. DOI (2019).
Falk, S. et al. Numerical investigation of the hydrodynamics of changing fin positions within a 4-fin surfboard configuration. Appl. Sci. 10(3), 816. DOI (2020).
Romanin, A. et al. Surfing equipment and design: A scoping review. Sports Eng. 24, 1–13. DOI(2021).
Roberts, J. R., Jones, R., Mansfield, N. J. & Rothberg, S. J. Evaluation of vibrotactile sensations in the feel of a golf shot. J. Sound Vibr. 285, 303–319. DOI (2004).
Fisher, C. et al. What static and dynamic properties should slalom skis possess? Judgements by advanced and expert skiers. J. Sports Sci. 25(14), 1567–1576. DOI (2007).