All scripts mentioned here can be found at https://github.com/ninaeba/EmbodiedResonance
Exploratory Motivation and Dataset Relevance
At the current stage of the project, before engaging with real-time biofeedback sensors or integrating hardware systems, I deliberately chose to begin with a simulation-based exploration using publicly available physiological datasets. This decision was grounded in both practical and conceptual motivations. On one hand, working with curated datasets provides a stable, low-risk environment to test hypotheses, establish workflows, and identify relevant signal characteristics. On the other hand, it also offered an opportunity to engage critically with the structure, semantics, and limitations of real-world psychophysiological recordings—particularly in the context of trauma-related conditions.
My personal interest in trauma physiology, shaped by lived experience during the war in Ukraine, has influenced the conceptual direction of this work. I was particularly drawn to understanding how conditions such as post-traumatic stress disorder (PTSD) might leave measurable traces in the body—traces that could be explored not only scientifically, but also sonically and artistically. This interest was further informed by reading The Body Keeps the Score by Bessel van der Kolk, which inspired me to look for empirical signals that reflect internal states which often remain inaccessible through language alone.
With this perspective in mind, I selected a large dataset focused on stress-induced myocardial ischemia as a starting point. Although the dataset was not originally designed to study PTSD, it includes a diverse group of participants—among them individuals diagnosed with PTSD, as well as others with complex comorbidities such as coronary artery disease and anxiety-related disorders. The richness of this cohort, combined with the inclusion of multiple biosignals (ECG, respiration, blood pressure), makes it a promising foundation for exploratory analyses.
Rather than seeking definitive conclusions at this point, my aim is to uncover what is possible—to understand which physiological patterns may hold relevance for trauma detection, and how they might be interpreted or transformed into expressive modalities such as sound or movement. This stage of the project is therefore best described as investigative and generative: it is about opening up space for experimentation and reflection, rather than narrowing toward specific outcomes.
Data Preparation and Extraction of Clinical Metadata from JSON Records
To efficiently identify suitable subjects for simulation, I first downloaded a complete index of data file links provided by the repository. Using a regular expression-based filtering mechanism implemented in Python, I programmatically extracted only those links pointing to disease-related JSON records for individual subjects (i.e., files following the pattern sub_XXX_disease.json). This was performed using a custom script (see downloaded_disease_files.py) which reads the full list of URLs from a text file and downloads the filtered subset into a local directory. A total of 119 such JSON records were retrieved.

Following acquisition, a second Python script (summary.py) was used to parse each JSON file and consolidate its contents into a single structured table. Each JSON file contained binary and categorical information corresponding to specific diagnostic criteria, including presence of PTSD, angina, stress-induced ischemia, pharmacological responses, and psychological traits (e.g., anxiety and depression scale scores, Type D personality indicators).

The script extracted all available key-value pairs and added a subject_id field derived from the filename. These entries were stored in a pandas DataFrame and exported to a CSV file (patients_disease_table.csv). The resulting table forms the basis for all subsequent filtering and selection of patient profiles for simulation.
This pipeline enabled me to rapidly triage a heterogeneous dataset by transforming a decentralized JSON structure into a unified tabular format suitable for further querying, visualization, and real-time signal emulation.
Group Selection and Dataset Subsetting
In order to meaningfully simulate and compare physiological responses, I manually selected a subset of subjects from the larger dataset and organized them into four distinct groups based on diagnostic profiles derived from the structured disease table:
- Healthy group: Subjects with no recorded psychological or cardiovascular abnormalities.
- Mental health group: Subjects presenting only with psychological traits such as elevated anxiety, depressive symptoms, or Type D personality, but without ischemic or cardiac diagnoses.
- PTSD group: Subjects with a verified PTSD diagnosis, often accompanied by anxiety traits and non-obstructive angina, but without broader comorbidities.
- Clinically sick group: Subjects with extensive multi-morbidity, showing positive indicators across most of the diagnostic criteria including ischemia, psychological disorders, and cardiovascular dysfunctions.

This manual classification enabled targeted downloading of signal data for only those subjects who are of particular interest to the ongoing research.
A custom Python script was then used to selectively retrieve only the relevant signal files—namely, 500 Hz ECG recordings from three phases (rest, stress, recovery) and the corresponding clinical complaint JSON files. The script filters a list of raw download links by matching both the subject ID and filename patterns. Each file is downloaded into a separate folder named after its respective group, thereby preserving the classification structure for downstream analysis and simulation.

Preprocessing of Raw ECG Signal Files
Upon downloading the raw signal files for the selected subjects, several structural and formatting issues became immediately apparent. These challenges rendered the original data format unsuitable for direct use in real-time simulation or further analysis. Specifically:
- Scientific Notation Format
All signal values were encoded in scientific notation (e.g., 3.2641e+02), requiring transformation into standard integer format suitable for time-domain processing and sonification. - Flattened and Fragmented Data
Each file contained a single long sequence of values with no clear delimiters or column headers. In some cases, the formatting introduced line breaks within numbers, further complicating parsing and extraction. - Twelve-Lead ECG in a Single File
The signal for all 12 ECG leads was stored in a single continuous stream, without metadata or segmentation markers. The only known constraint was that the total length of the signal was always divisible by 12, implying equal-length segments per lead. - Separated Recording Phases
Data for each subject was distributed across three files, each corresponding to one of the experimental phases: rest, stress, and recovery. For the purposes of this project—particularly real-time emulation and comparative analysis—I required a single, merged file per lead containing the full time course across all three conditions.
Solution: Custom Parsing and Lead Separation Script
To address these challenges, I developed a two-stage Python script to convert the raw .csv files into a structured and usable format:

Step 1: Parsing and Lead Extraction
The script recursively traverses the directory tree to identify ECG files by filename patterns. For each file:
The ECG phase (rest, stress, or recover) is inferred from the filename.
The subject ID is extracted using regular expressions.
All scientific-notation numbers are matched and converted into integers. Unrealistically large values (above 10,000) are filtered out to prevent corruption.
The signal is split into 12 equally sized segments, corresponding to the 12 ECG leads. Each lead is saved as a separate .csv file inside a folder structure organized by subject and phase.

Step 2: Lead-Wise Concatenation Across Phases
Once individual leads for each phase were saved, the script proceeds to merge the rest, stress, and recovery segments for each lead:
For every subject, it locates the three corresponding files for each lead.
These files are concatenated vertically (along the time axis) to form a continuous signal.
The resulting merged signals are saved in a dedicated combined folder per subject, with filenames that indicate the lead number and sampling rate.
This conversion pipeline transforms non-tabular raw data into standardized time series inputs suitable for further processing, visualization, or real-time simulation.

Manual Signal Inspection and Selection of Representative Subjects
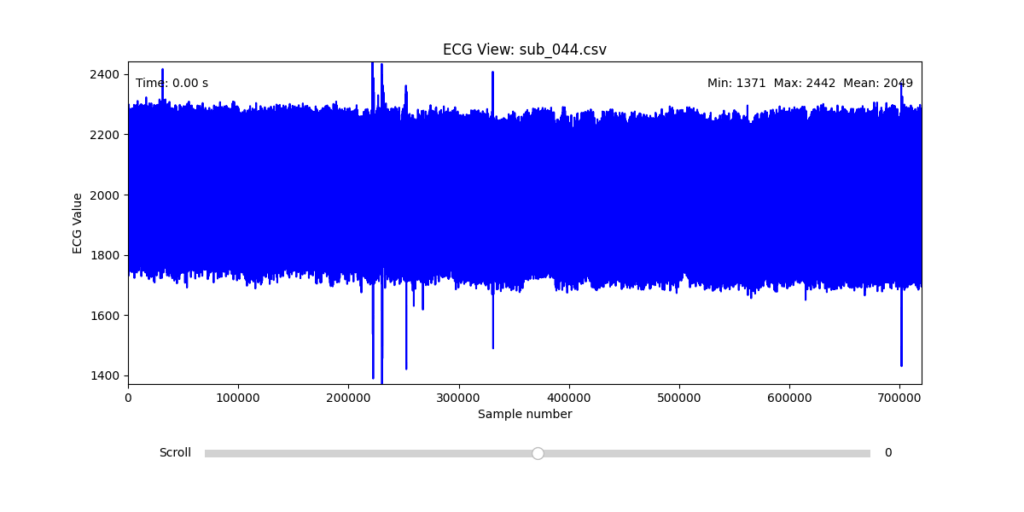
While the data transformation pipeline produced technically readable ECG signals, closer inspection revealed a range of physiological artifacts likely introduced during the original data acquisition process. These irregularities included signal clipping, baseline drift, and abrupt discontinuities. In many cases, such artifacts can be attributed not to software or conversion errors, but to common physiological and mechanical factors—such as subject movement, poor electrode contact, skin conductivity variation due to perspiration, or unstable placement of leads during the recording.
These artifacts are highly relevant from a performative and conceptual standpoint. Movement-induced noise and instability in bodily measurements reflect the lived, embodied realities of trauma, and they may eventually be used as expressive material within the performance itself. However, for the purpose of initial analysis and especially heart rate variability (HRV) extraction, such disruptions compromise signal clarity and algorithmic robustness.
To navigate this complexity, I conducted a manual review of the ECG signals for all 16 selected subjects. Each of the 12 leads per subject was visually examined across the three experimental phases (rest, stress, and recovery). From this process, I identified one subject from each group (healthy, mental health, PTSD, and clinically sick) whose signals displayed the least amount of distortion and were most suitable for initial HRV-focused simulation.
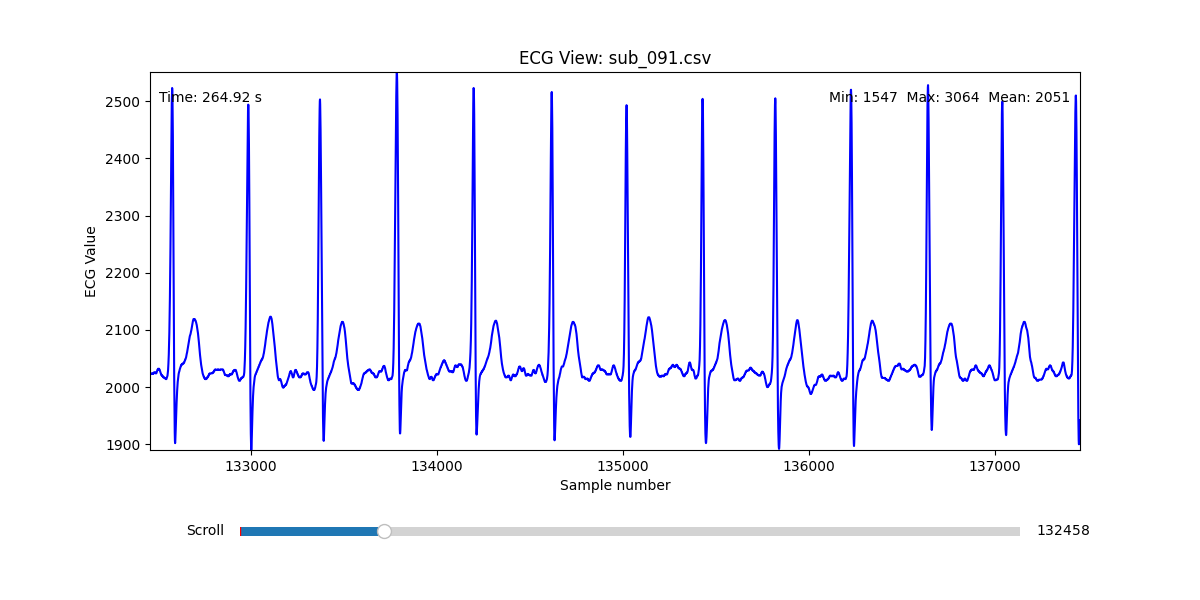
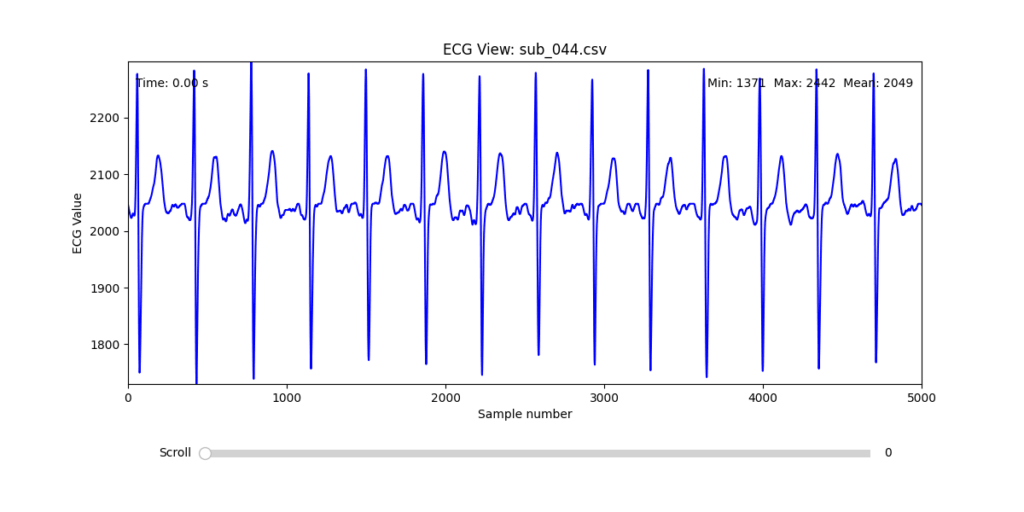
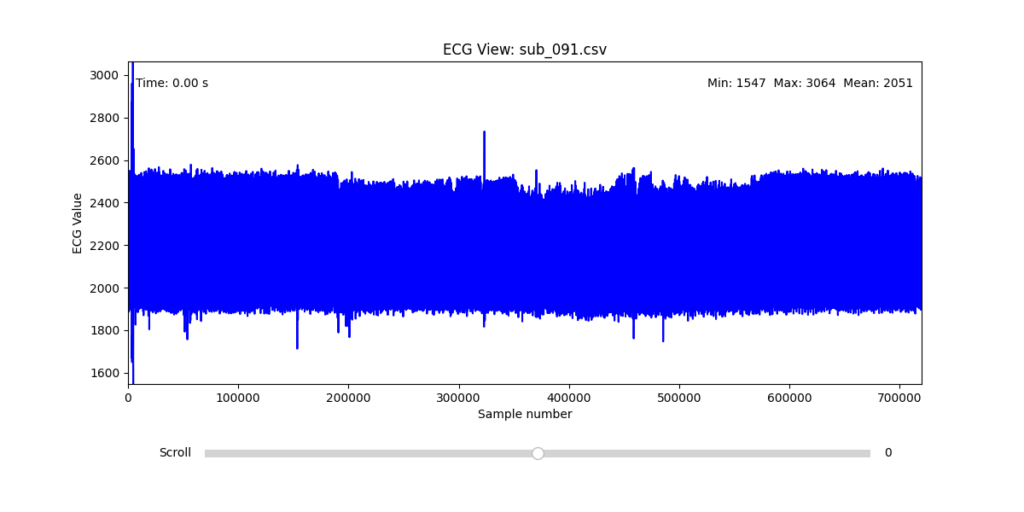
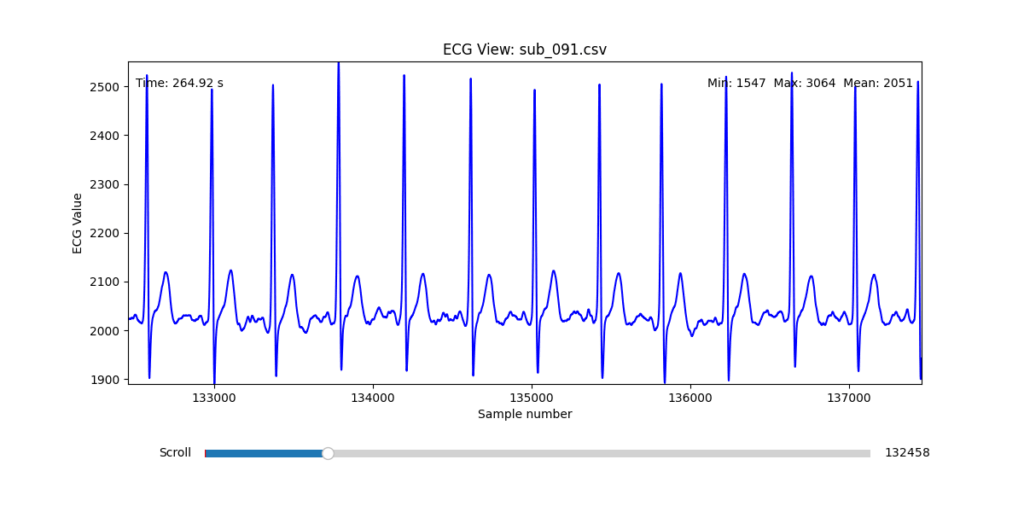
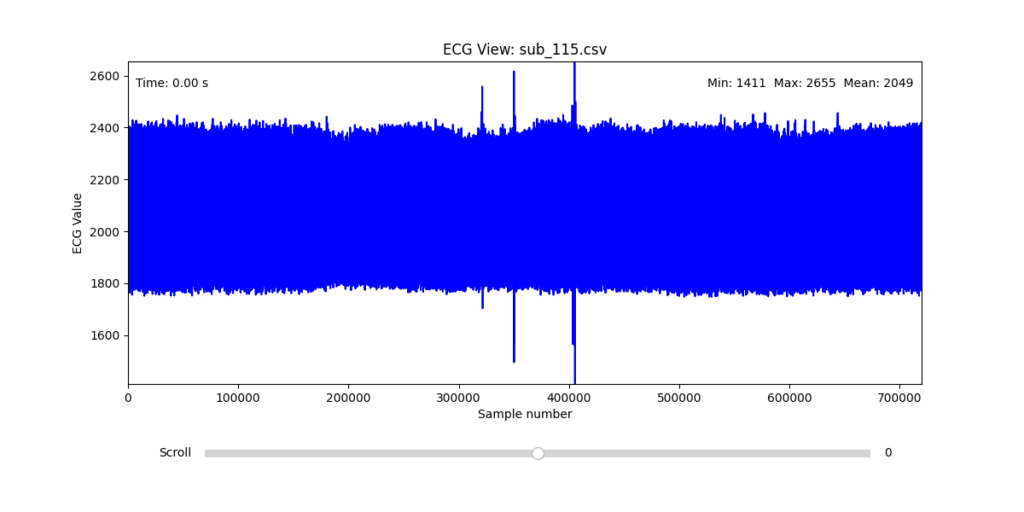
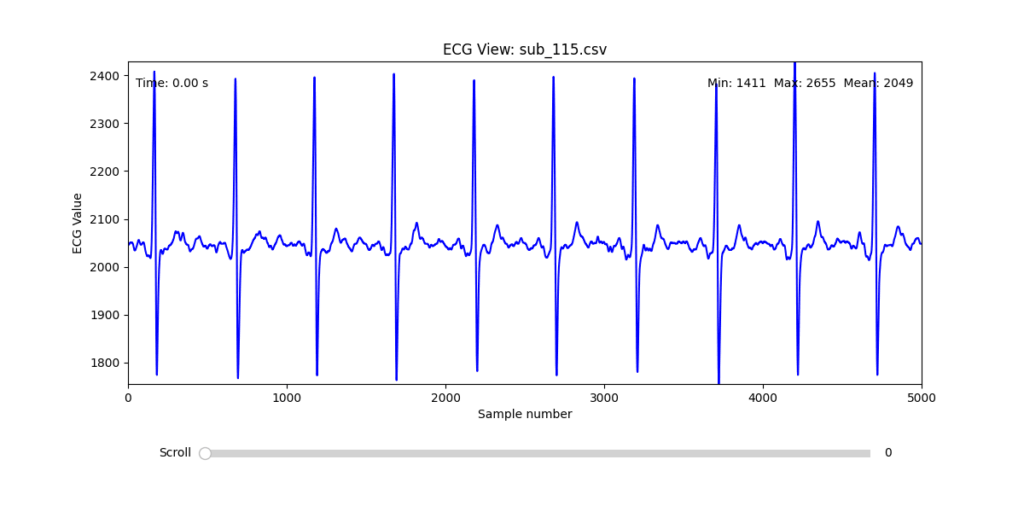
Diagnostic Visualization Tool
To facilitate and streamline this selection process, I implemented a simple interactive visualization tool in Python. This utility allows for scrollable navigation through long ECG recordings, with a resizable window and basic summary statistics (min, max, mean values). It was essential for rapidly identifying where signal corruption occurred and assessing lead quality in a non-automated but highly effective way.

This tool enabled both quantitative assessment and intuitive engagement with the data, providing a necessary bridge between raw measurement and informed experimental design.
Selection of Final Subjects and Optimal ECG Leads
Following visual inspection of all 12 ECG leads across the 16 initially shortlisted subjects, I selected one representative from each diagnostic group whose recordings exhibited the highest signal quality and least interference. The selection was based on manual analysis using the custom-built scrollable ECG viewer, with particular attention given to the clarity and prominence of QRS complexes—a critical factor for accurate heart rate variability (HRV) analysis. The final subjects are: 005, 044, 091, 115:
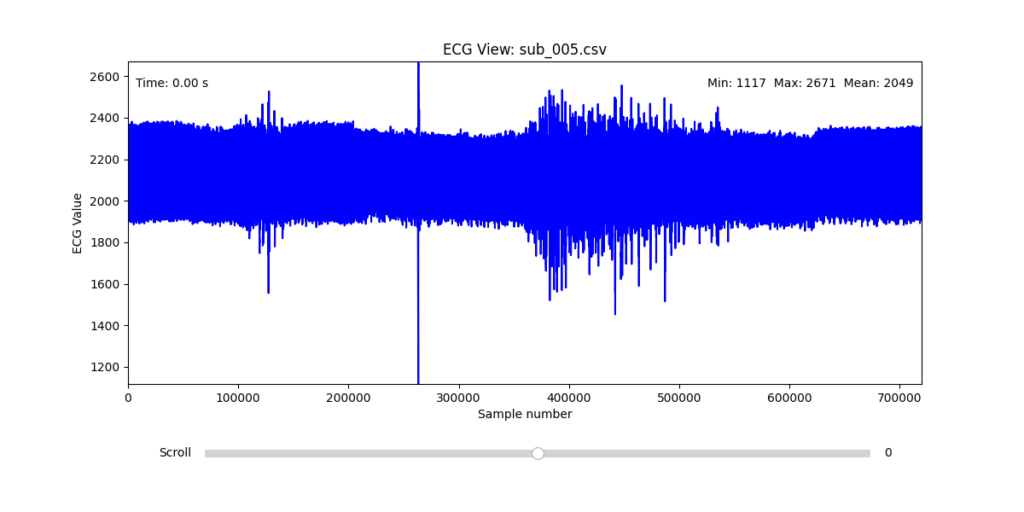
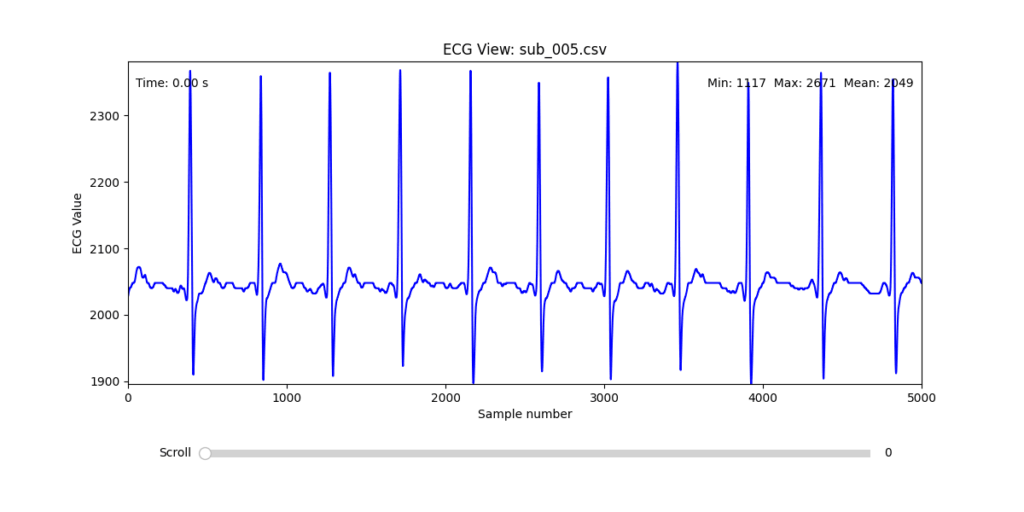
These signals will serve as the primary input for all upcoming simulation and sonification stages. While artifacts remain an inherent part of physiological measurement—especially in ambulatory or emotionally charged conditions—this selection aims to provide a clean analytical baseline from which to explore more experimental, expressive interpretations in later phases.
References:
Van der Kolk, Bessel A. 2014. The Body Keeps the Score: Brain, Mind, and Body in the Healing of Trauma. New York: Viking.
Zhou, Rui, Jichao Sun, and Chao Wang. 2023. “Mental Stress-Induced Myocardial Ischemia Data Resource.” Science Data Bank, V1. https://www.scidb.cn/en/detail?dataSetId=b0450f87867b439ba63d81d4ca20665c&version=V1